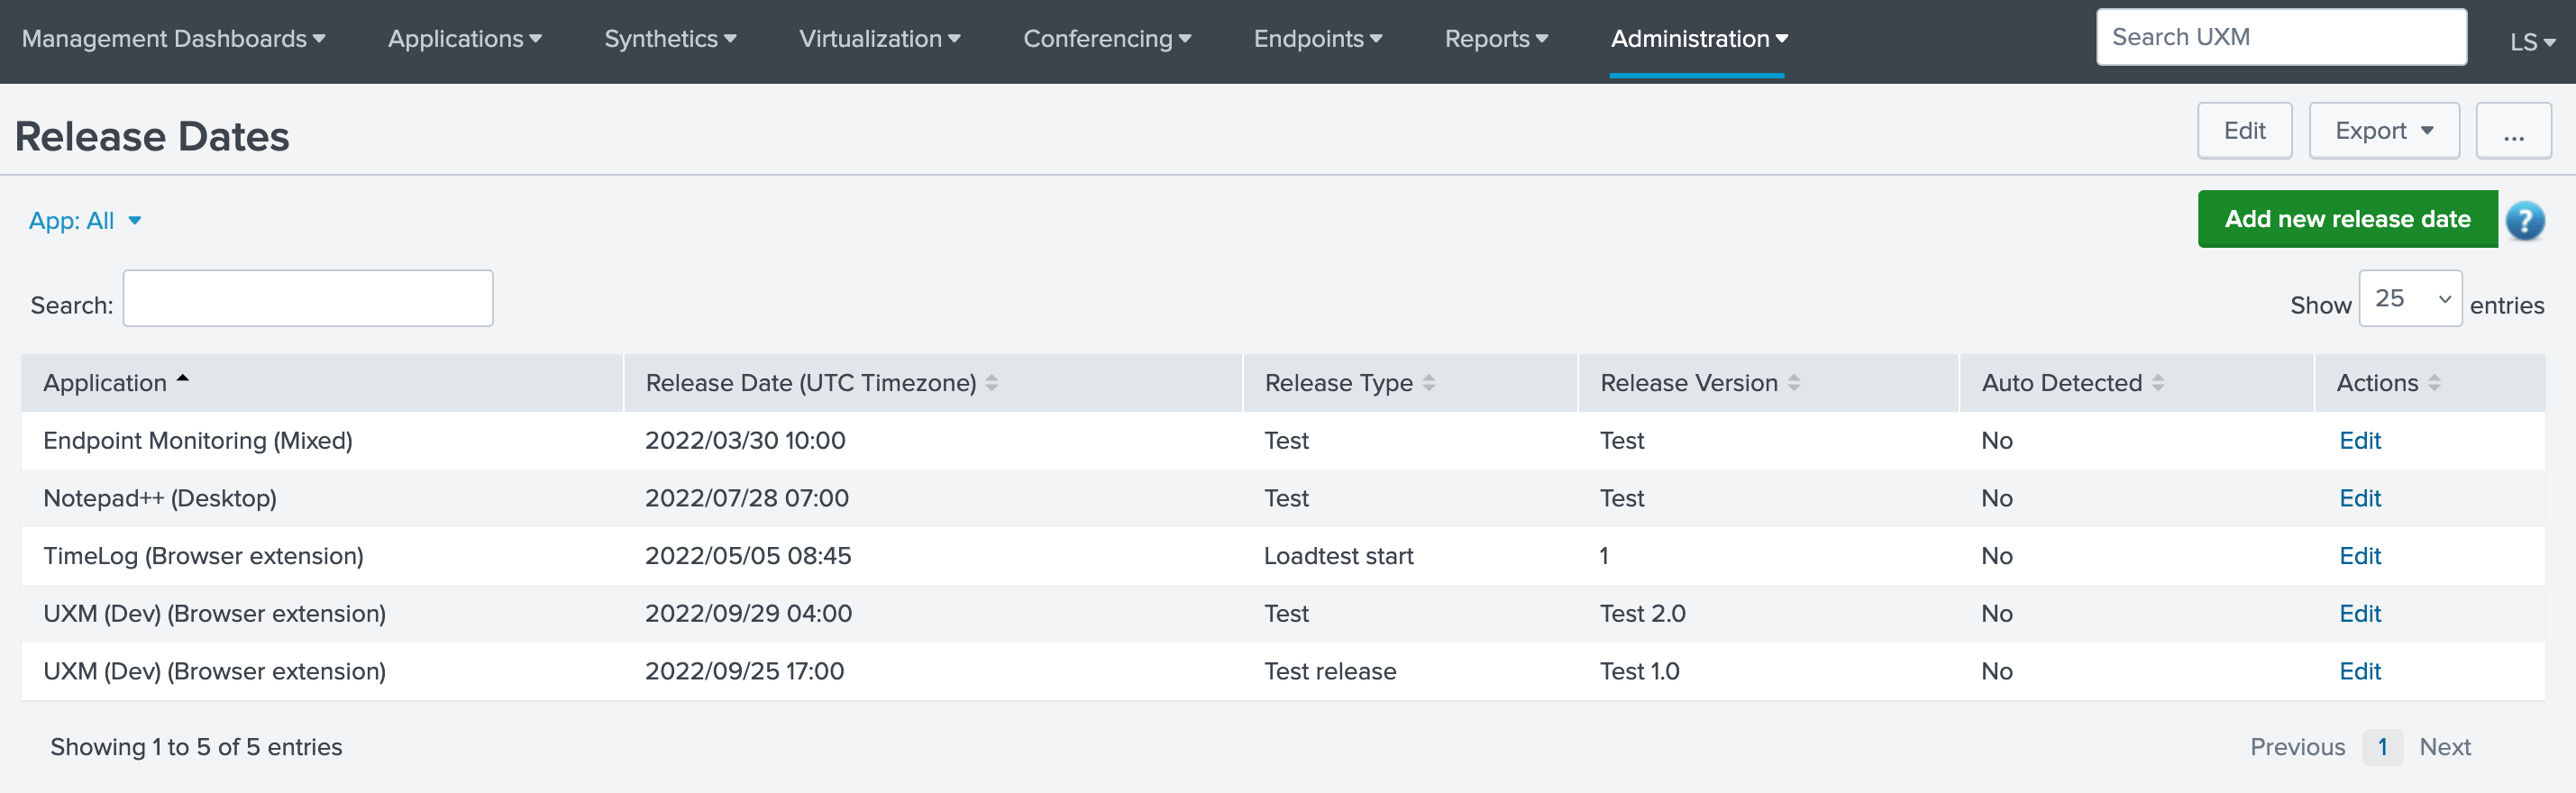
Release Dates
This page allows users to enter release dates for applications that can be displayed in report and charts as annotations.
Add/Edit Release Date
Release dates can be added by pressing "Add new release date" and edited by selecting the Edit text link to the right for the release date.
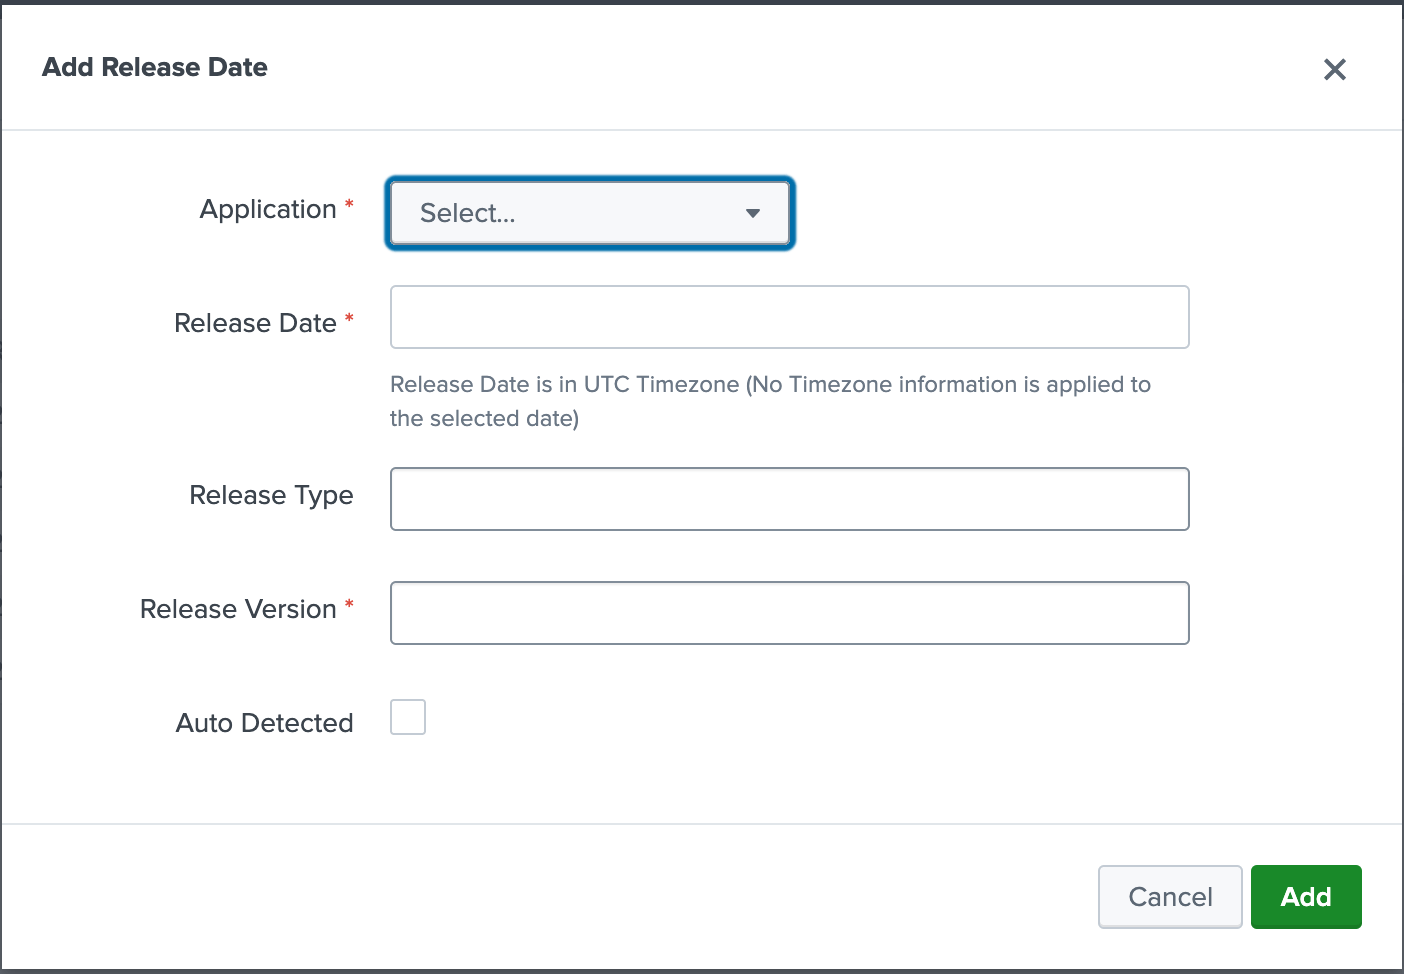
The following fields are available:
- Application: The application that the release date is placed under, Applications can be created under Administration -> Applications.
- Release Date: Date the release was deployed to the application, please note that the date is in UTC/GMT+0 timezone, no timezone information is applied from the logged in users timezone. (In YYYY/MM/DD)
- Release Type: Type of the release, can be blank or description of the release, like if it was a Patch, Full release or Performance Improvement.
- Release Version: Version for the release, can be a description, date or version code like 1.11.2.
- Auto Detected: Automatically filled out, indicated that UXM discovered the version automatically, UXM detects version for monitored Desktop applications and creates the release dates automatically. (If the Scheduled Search "Desktop - Auto-Detect Release Dates" is enabled)
Auto Detecting New Versions for UXM Desktop Applications
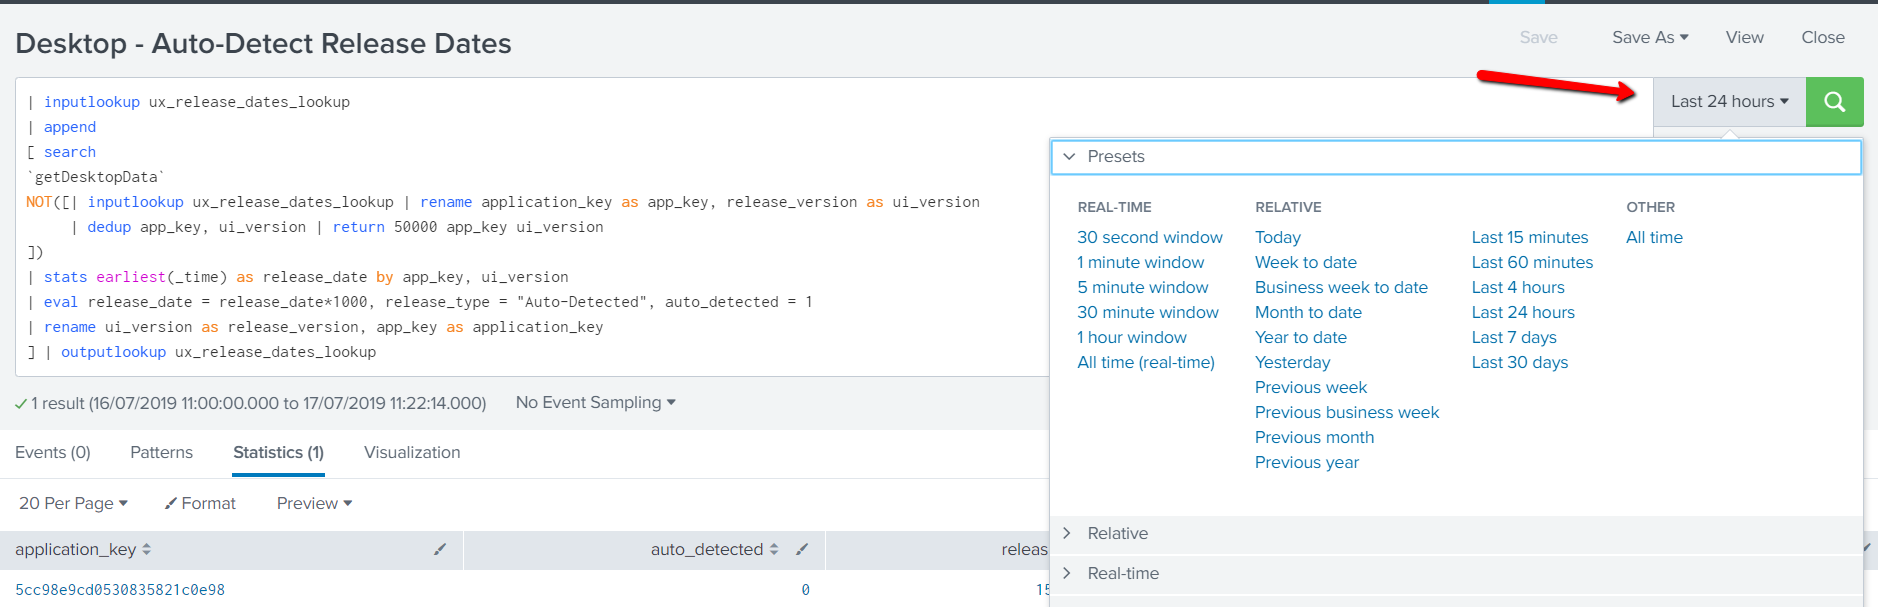
You can activate the scheduled search that detects new releases every day by going to Settings -> Searches, Reports, and Alerts, and filtering on "release". Select Edit and Enable.
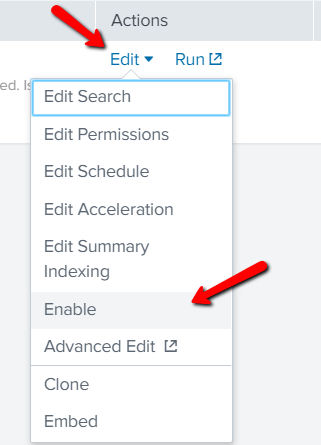
You can select Run to create the versions seen the "Last 24 hour" and change the time filter further back to get old release dates created for UXM Desktop applications.
Splunk SPL for Chart with Annotations
Please note that >= has to be replaced with >= if copying directly into XML source
<row>
<panel>
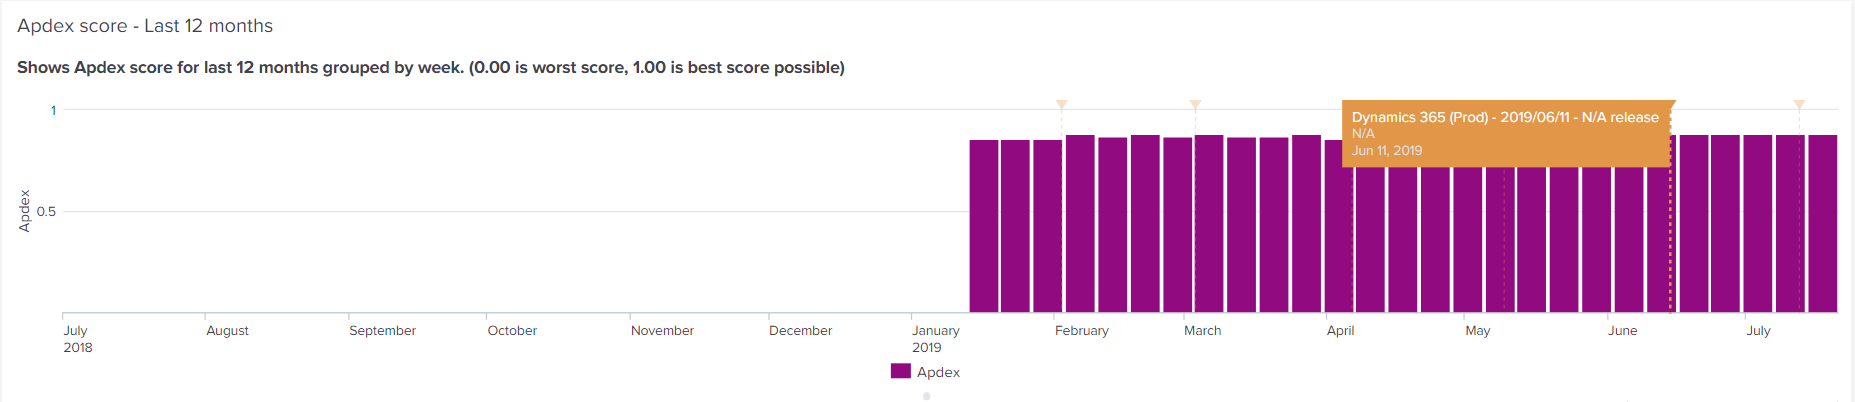
<title>Apdex score - Last 12 months</title>
<chart>
<title>Shows Apdex score for last 12 months grouped by week. (0.00 is worst score, 1.00 is best score possible)</title>
<search>
<query>
`getSummaryIndex(resolution=hourly,source=web,type=general)` app\_key="5c3852d8d0530808e00ad8ab"
| eval satisfiedCount = if(sla==0,1,0) | eval toleratedCount = if(sla==1,1,0) | eval frustratedCount = if(sla==2,1,0)
| stats sum(satisfiedCount) as satisfiedCount, sum(toleratedCount) as toleratedCount, sum(frustratedCount) as frustratedCount, count AS totalCount by \_time
| eval Apdex = (((satisfiedCount\*1) + (toleratedCount\*0.5) + (frustratedCount\*0)) / totalCount)
| timechart span=1w eval(round(avg(Apdex),2)) as "Apdex"
</query>
<earliest>-12mon@mon</earliest>
<latest>now</latest>
<sampleRatio>1</sampleRatio>
</search>
<search type="annotation">
<query>
| inputlookup ux\_release\_dates\_lookup | where application\_key="5c3852d8d0530808e00ad8ab"
| eval \_time=strptime(release\_date, "%Y/%m/%d") | addinfo | where \_time>=info\_min\_time
| lookup ux\_applications\_lookup \_key AS application\_key OUTPUT name AS applicationNameLookup
| fillnull value="" release\_type applicationNameLookup
| strcat applicationNameLookup " - " release\_version " - " release\_type annotation\_label
| eval annotation\_category = release\_type
| fields \_time, annotation\_label, annotation\_category
</query>
<earliest>-12mon@mon</earliest>
<latest>now</latest>
</search>
<!-- Customize the event annotation colors based on category name -->
<option name="charting.annotation.categoryColors">{"Full":"0x006D9C","Patch":"0x53A051"}</option>
<option name="charting.axisLabelsX.majorLabelStyle.overflowMode">ellipsisNone</option>
<option name="charting.axisLabelsX.majorLabelStyle.rotation">0</option>
<option name="charting.axisTitleX.visibility">collapsed</option>
<option name="charting.axisTitleY.visibility">visible</option>
<option name="charting.axisTitleY2.visibility">visible</option>
<option name="charting.axisX.abbreviation">none</option>
<option name="charting.axisX.scale">linear</option>
<option name="charting.axisY.abbreviation">none</option>
<option name="charting.axisY.maximumNumber">1.0</option>
<option name="charting.axisY.minimumNumber">0.0</option>
<option name="charting.axisY.scale">linear</option>
<option name="charting.axisY2.abbreviation">none</option>
<option name="charting.axisY2.enabled">0</option>
<option name="charting.axisY2.scale">inherit</option>
<option name="charting.chart">column</option>
<option name="charting.chart.bubbleMaximumSize">50</option>
<option name="charting.chart.bubbleMinimumSize">10</option>
<option name="charting.chart.bubbleSizeBy">area</option>
<option name="charting.chart.nullValueMode">gaps</option>
<option name="charting.chart.showDataLabels">none</option>
<option name="charting.chart.sliceCollapsingThreshold">0.01</option>
<option name="charting.chart.stackMode">default</option>
<option name="charting.chart.style">shiny</option>
<option name="charting.drilldown">none</option>
<option name="charting.fieldColors">{"Apdex":0x920a80}}</option>
<option name="charting.layout.splitSeries">0</option>
<option name="charting.layout.splitSeries.allowIndependentYRanges">0</option>
<option name="charting.legend.labelStyle.overflowMode">ellipsisMiddle</option>
<option name="charting.legend.mode">standard</option>
<option name="charting.legend.placement">bottom</option>
<option name="charting.lineWidth">2</option>
<option name="refresh.display">progressbar</option>
<option name="trellis.enabled">0</option>
<option name="trellis.scales.shared">1</option>
<option name="trellis.size">medium</option>
</chart>
</panel>
</row>
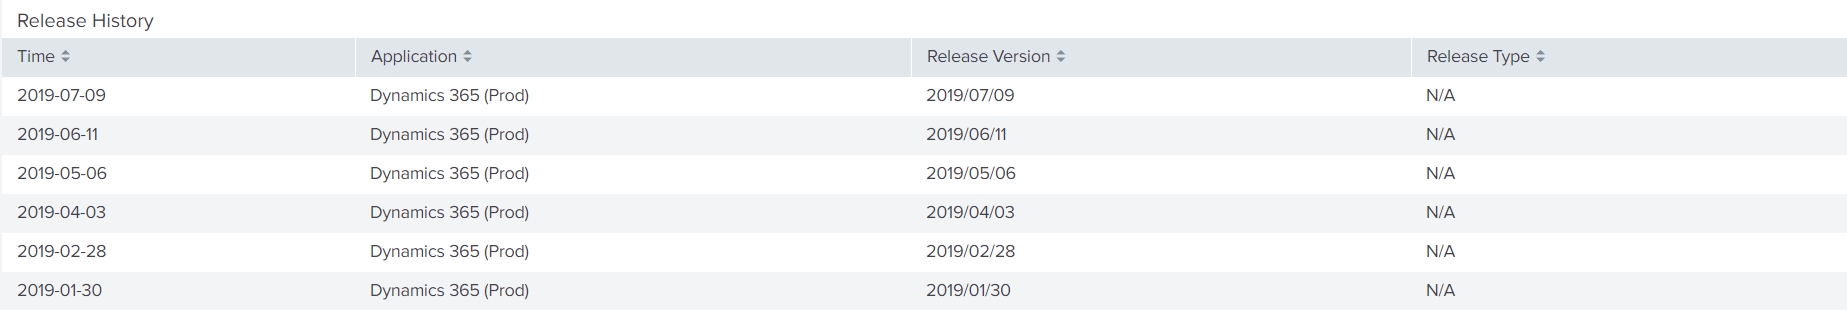
Splunk SPL for Table with Release Dates
Please note that >= has to be replaced with >= if copying directly into XML source
<row>
  <panel>
    <title>Release History</title>
    <table>
      <search>
        <query>
          | inputlookup ux\_release\_dates\_lookup | where (application\_key="5c3852d8d0530808e00ad8ab")
          | eval \_time=strptime(release\_date, "%Y/%m/%d") | addinfo | where \_time>=info\_min\_time
          | sort -\_time | eval SplunkTimeField = strftime(\_time, "%Y-%m-%d")
          | lookup ux\_applications\_lookup \_key AS application\_key OUTPUT name AS applicationNameLookup
          | fillnull value="" application release\_type applicationNameLookup
          | fields SplunkTimeField, applicationNameLookup, release\_version, release\_type | fields - \_time
          | rename SplunkTimeField AS "Time", applicationNameLookup AS "Application", release\_version AS "Release Version", release\_type AS "Release Type"
        </query>
        <earliest>-12mon@mon</earliest>
        <latest>now</latest>
      </search>
      <option name="drilldown">none</option>
      <option name="refresh.display">progressbar</option>
      <format type="color" field="Release Type">
        <colorPalette type="map">{"Full":#006D9C,"Patch":#53A051}</colorPalette>
      </format>
    </table>
  </panel>
</row>