Enterprise Dashboard
Real-User
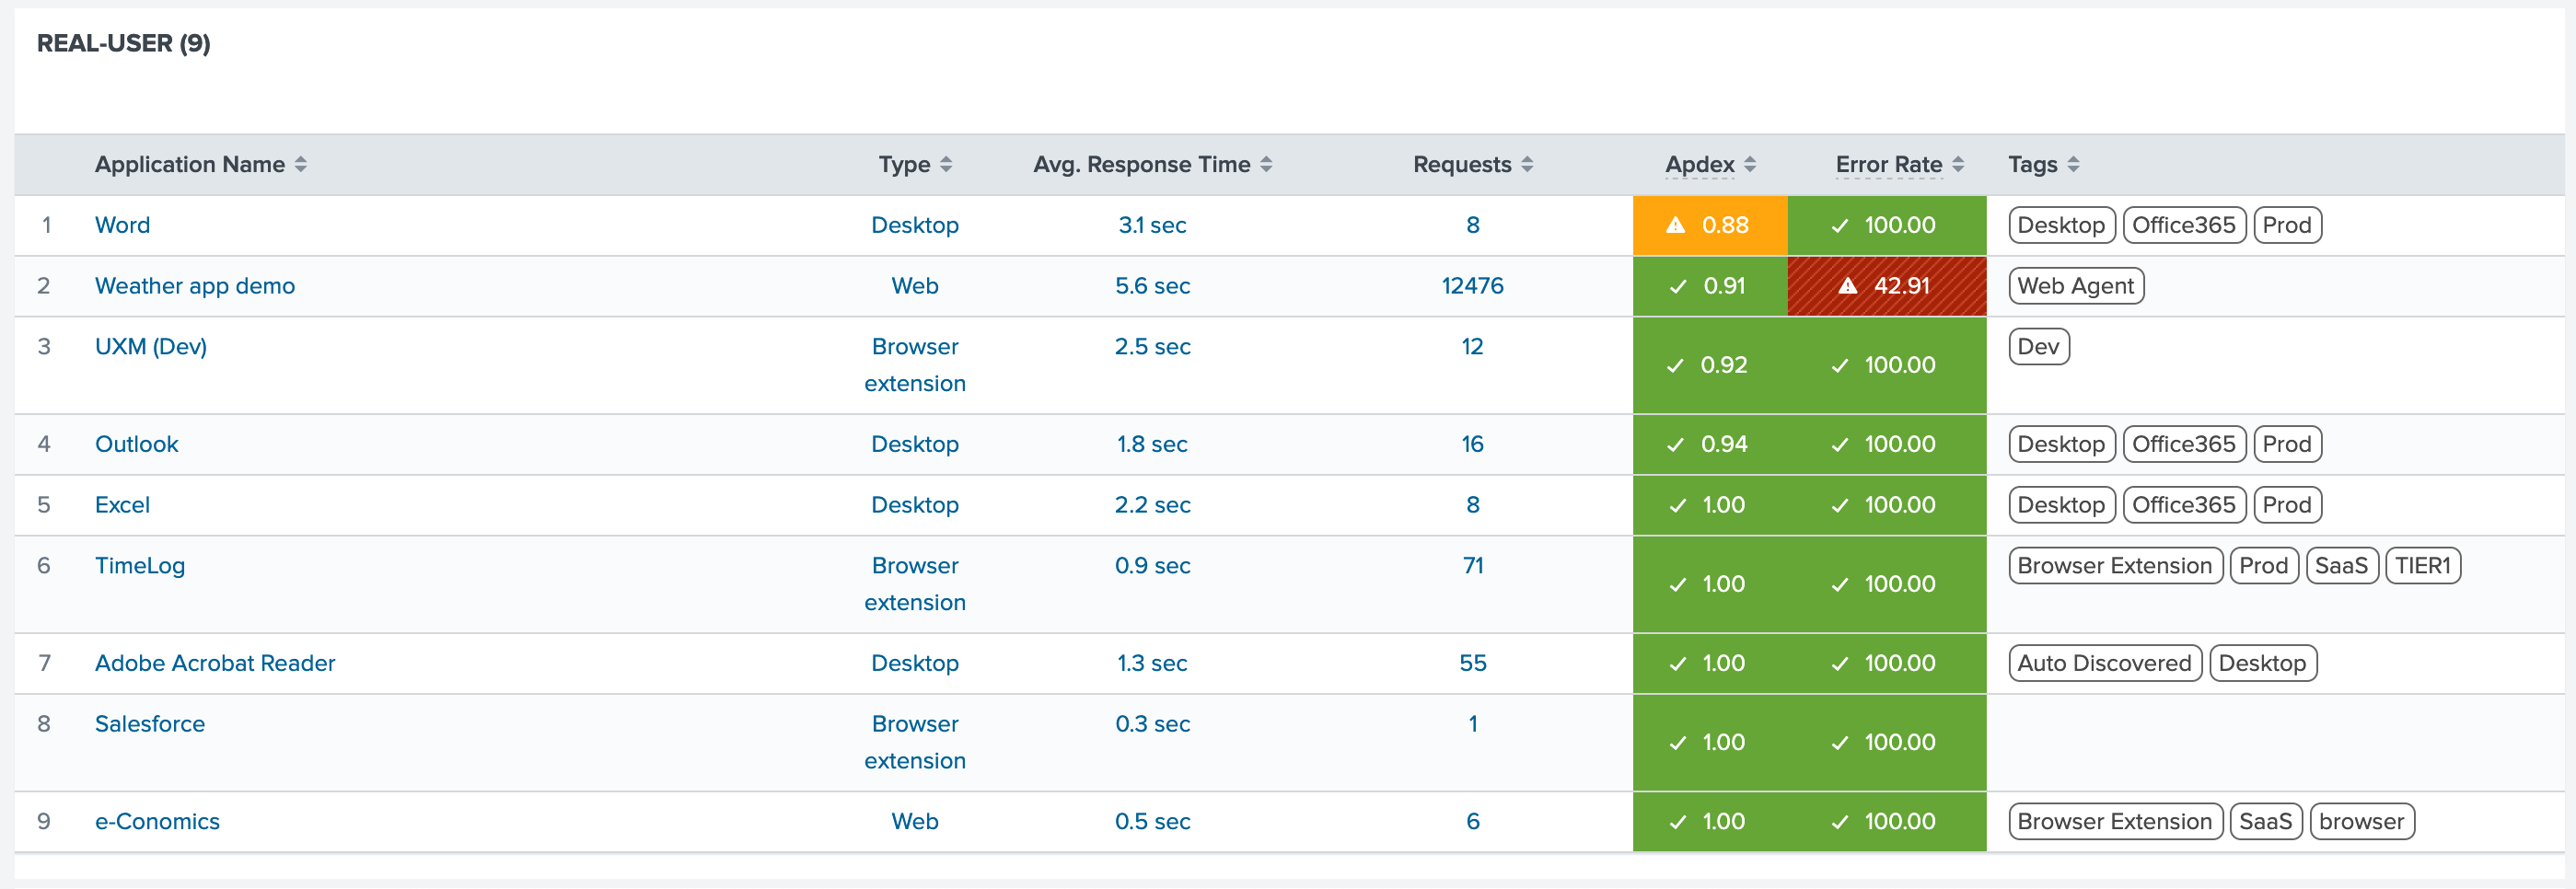
This section displays data from running applications and transactions executed by users. Presents the following information:
- Application Name: Shows the name of the application from which the transactions are being collected.
- Type: Indicates how data is being collected. Via Desktop, Web or Browser Extension.
- Avg. Response Time: Time that the Application takes to return the results of a request to the user.
- Requests: Number of petitions (actions, transactions) made to the Application.
- Apdex: Is a uniform way to analyze and report on the degree to which measured performance meets the SLA. Where 0.00 is the lowest score and 1.00 is the highest score possible.
- Error Rate: Represents the ratio of 5XX errors over the Requests performed. If value is above 1% is considered Warning level, over 5% is Critical.
- Tags: Helps to identify related categories.
Clicking on table rows will drill down to more detailed information based on application type.
Drilldown Dashboards
Microsoft Teams Quality
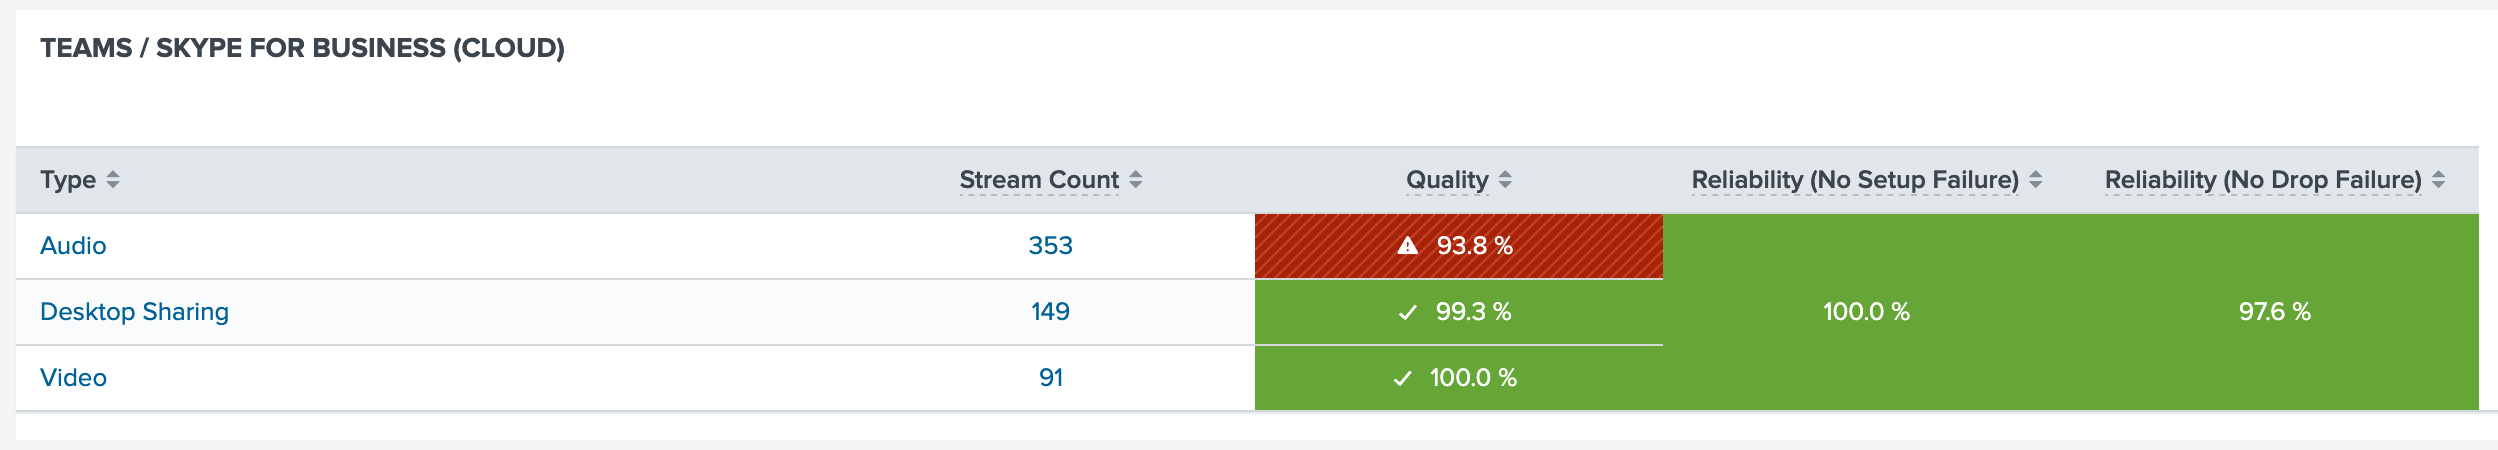
Analyse data from conferences and peer-to-peer calls, identify issues related to call quality. Information displayed:
- Type: Data is split by type in order to obtain results from each one of the streams during the call.
- Stream Count: Shows the total amount of streams.
- Quality: Is a combination of network performance and user experience metrics. For Desktop and Screen Sharing, it is recommended that value is greater than 99%, while for Video, over 97%.
- Reliability (No Setup Failure): The setup failure rate is the number of streams where the media path couldn't be established between the endpoints at the start of the call. This represents any media stream that couldn't be established. Given the severity of the impact of this problem on the user experience, the goal is to keep this value as close to 100% as possible.
- Reliability (No Drop Failure): The drop failure rate is the percentage of successfully established streams where the media path didn't terminate normally. This represents any media stream that terminated unexpectedly. Although the impact of this isn't as severe as a stream that failed to set up, it still negatively affects the user experience. Sudden and frequent media drops not only can have a severe impact on the user experience, they result in the need for users to reconnect, resulting in lost productivity (not to mention frustration).
Drilldown Dashboards
- Team Analysis Dashboard
Endpoints
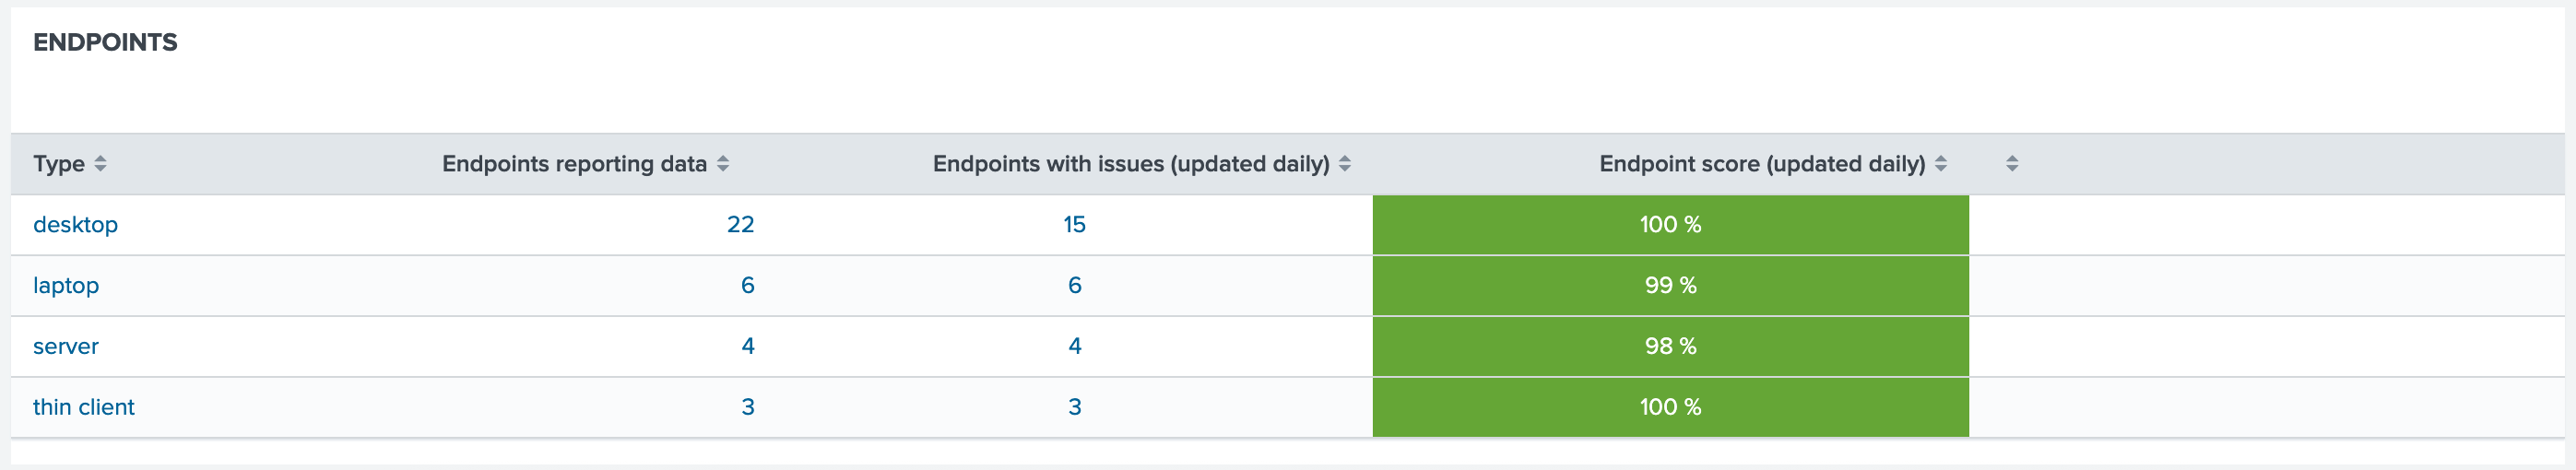
Provides information regarding the monitored endpoints.
- Type: Data is divided by endpoint type to improve analysis.
- Endpoints Reporting Data: Total amount of endpoints generating errors.
- Endpoints With Issues: Number of endpoints generating issues.
- Endpoints Score: Average score for endpoint's performance. The closer to 100 %, the better.
Drilldown Dashboards
- Endpoint Issues