Web Application Requests
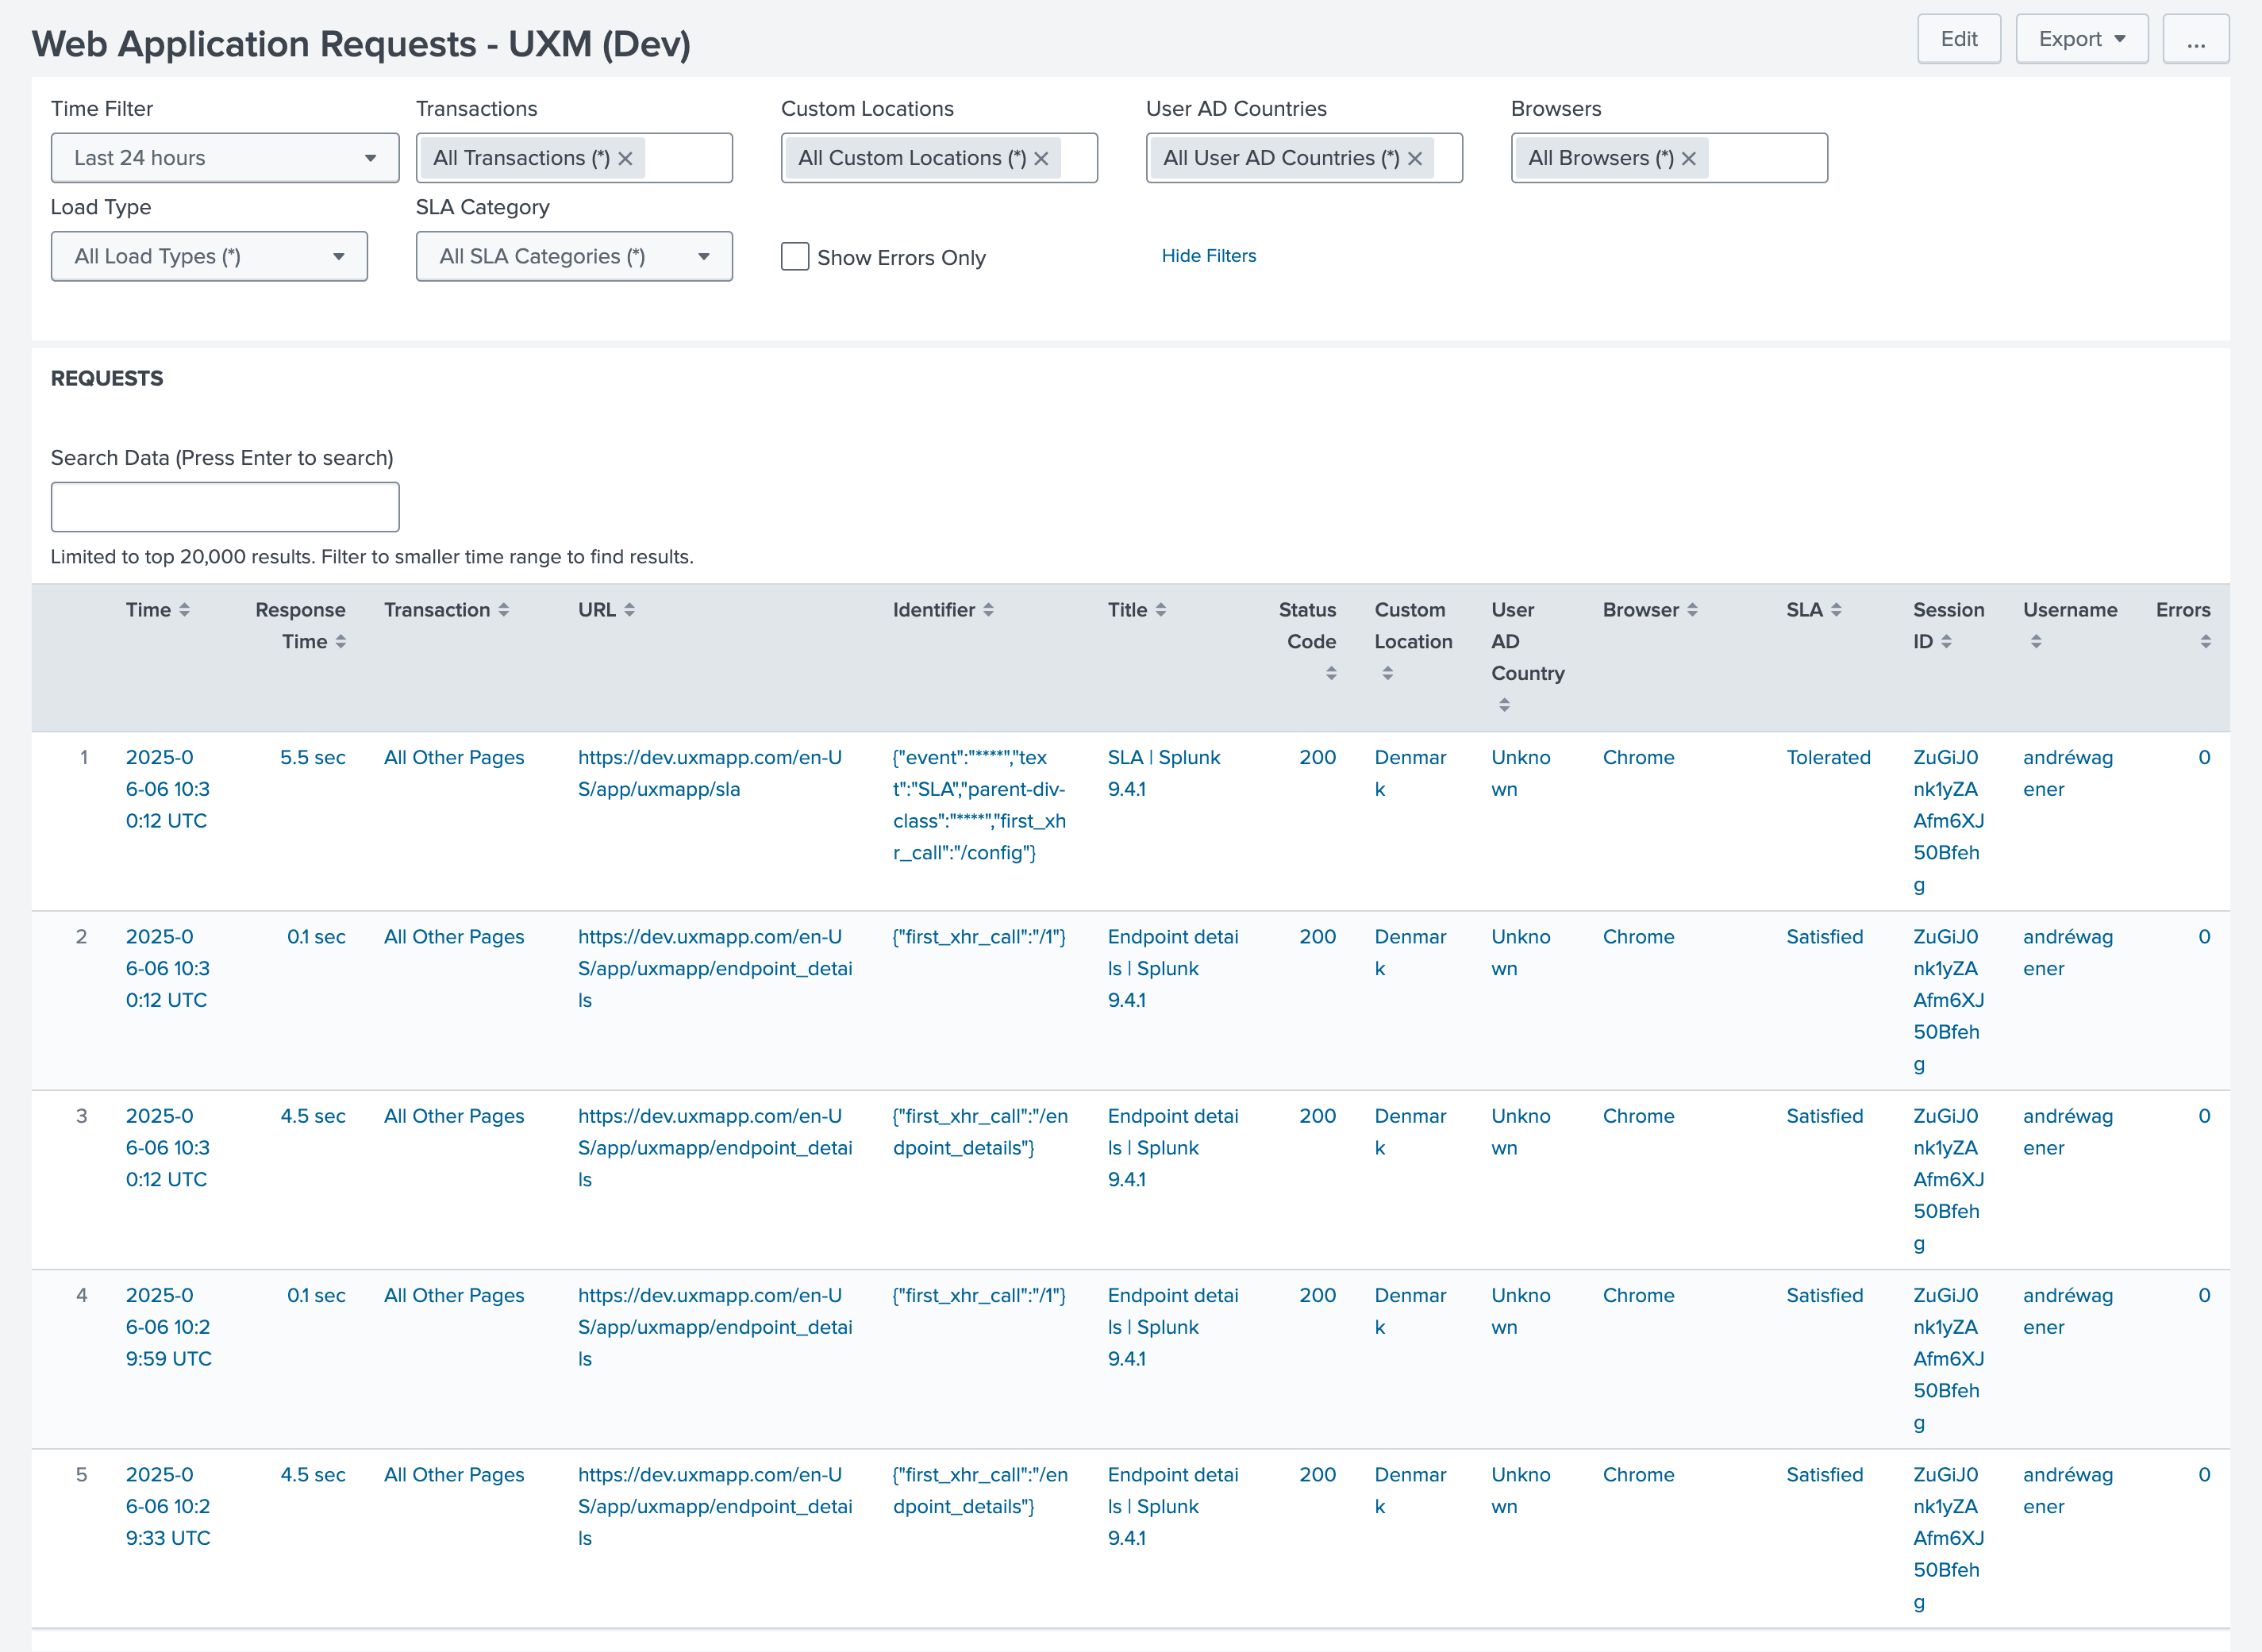
This table provides a detailed log of user requests for a specific web application, allowing for analysis and troubleshooting. Each row represents a single request, displaying the time, response time, transaction, URL, a unique identifier, and title.
It further breaks down the request with status code, custom location, user AD country, browser, SLA (Service Level Agreement) status, session ID, username and Error. This comprehensive view enables users to track request performance, identify errors, and understand user behavior based on location and browser.

Web Application Request Details
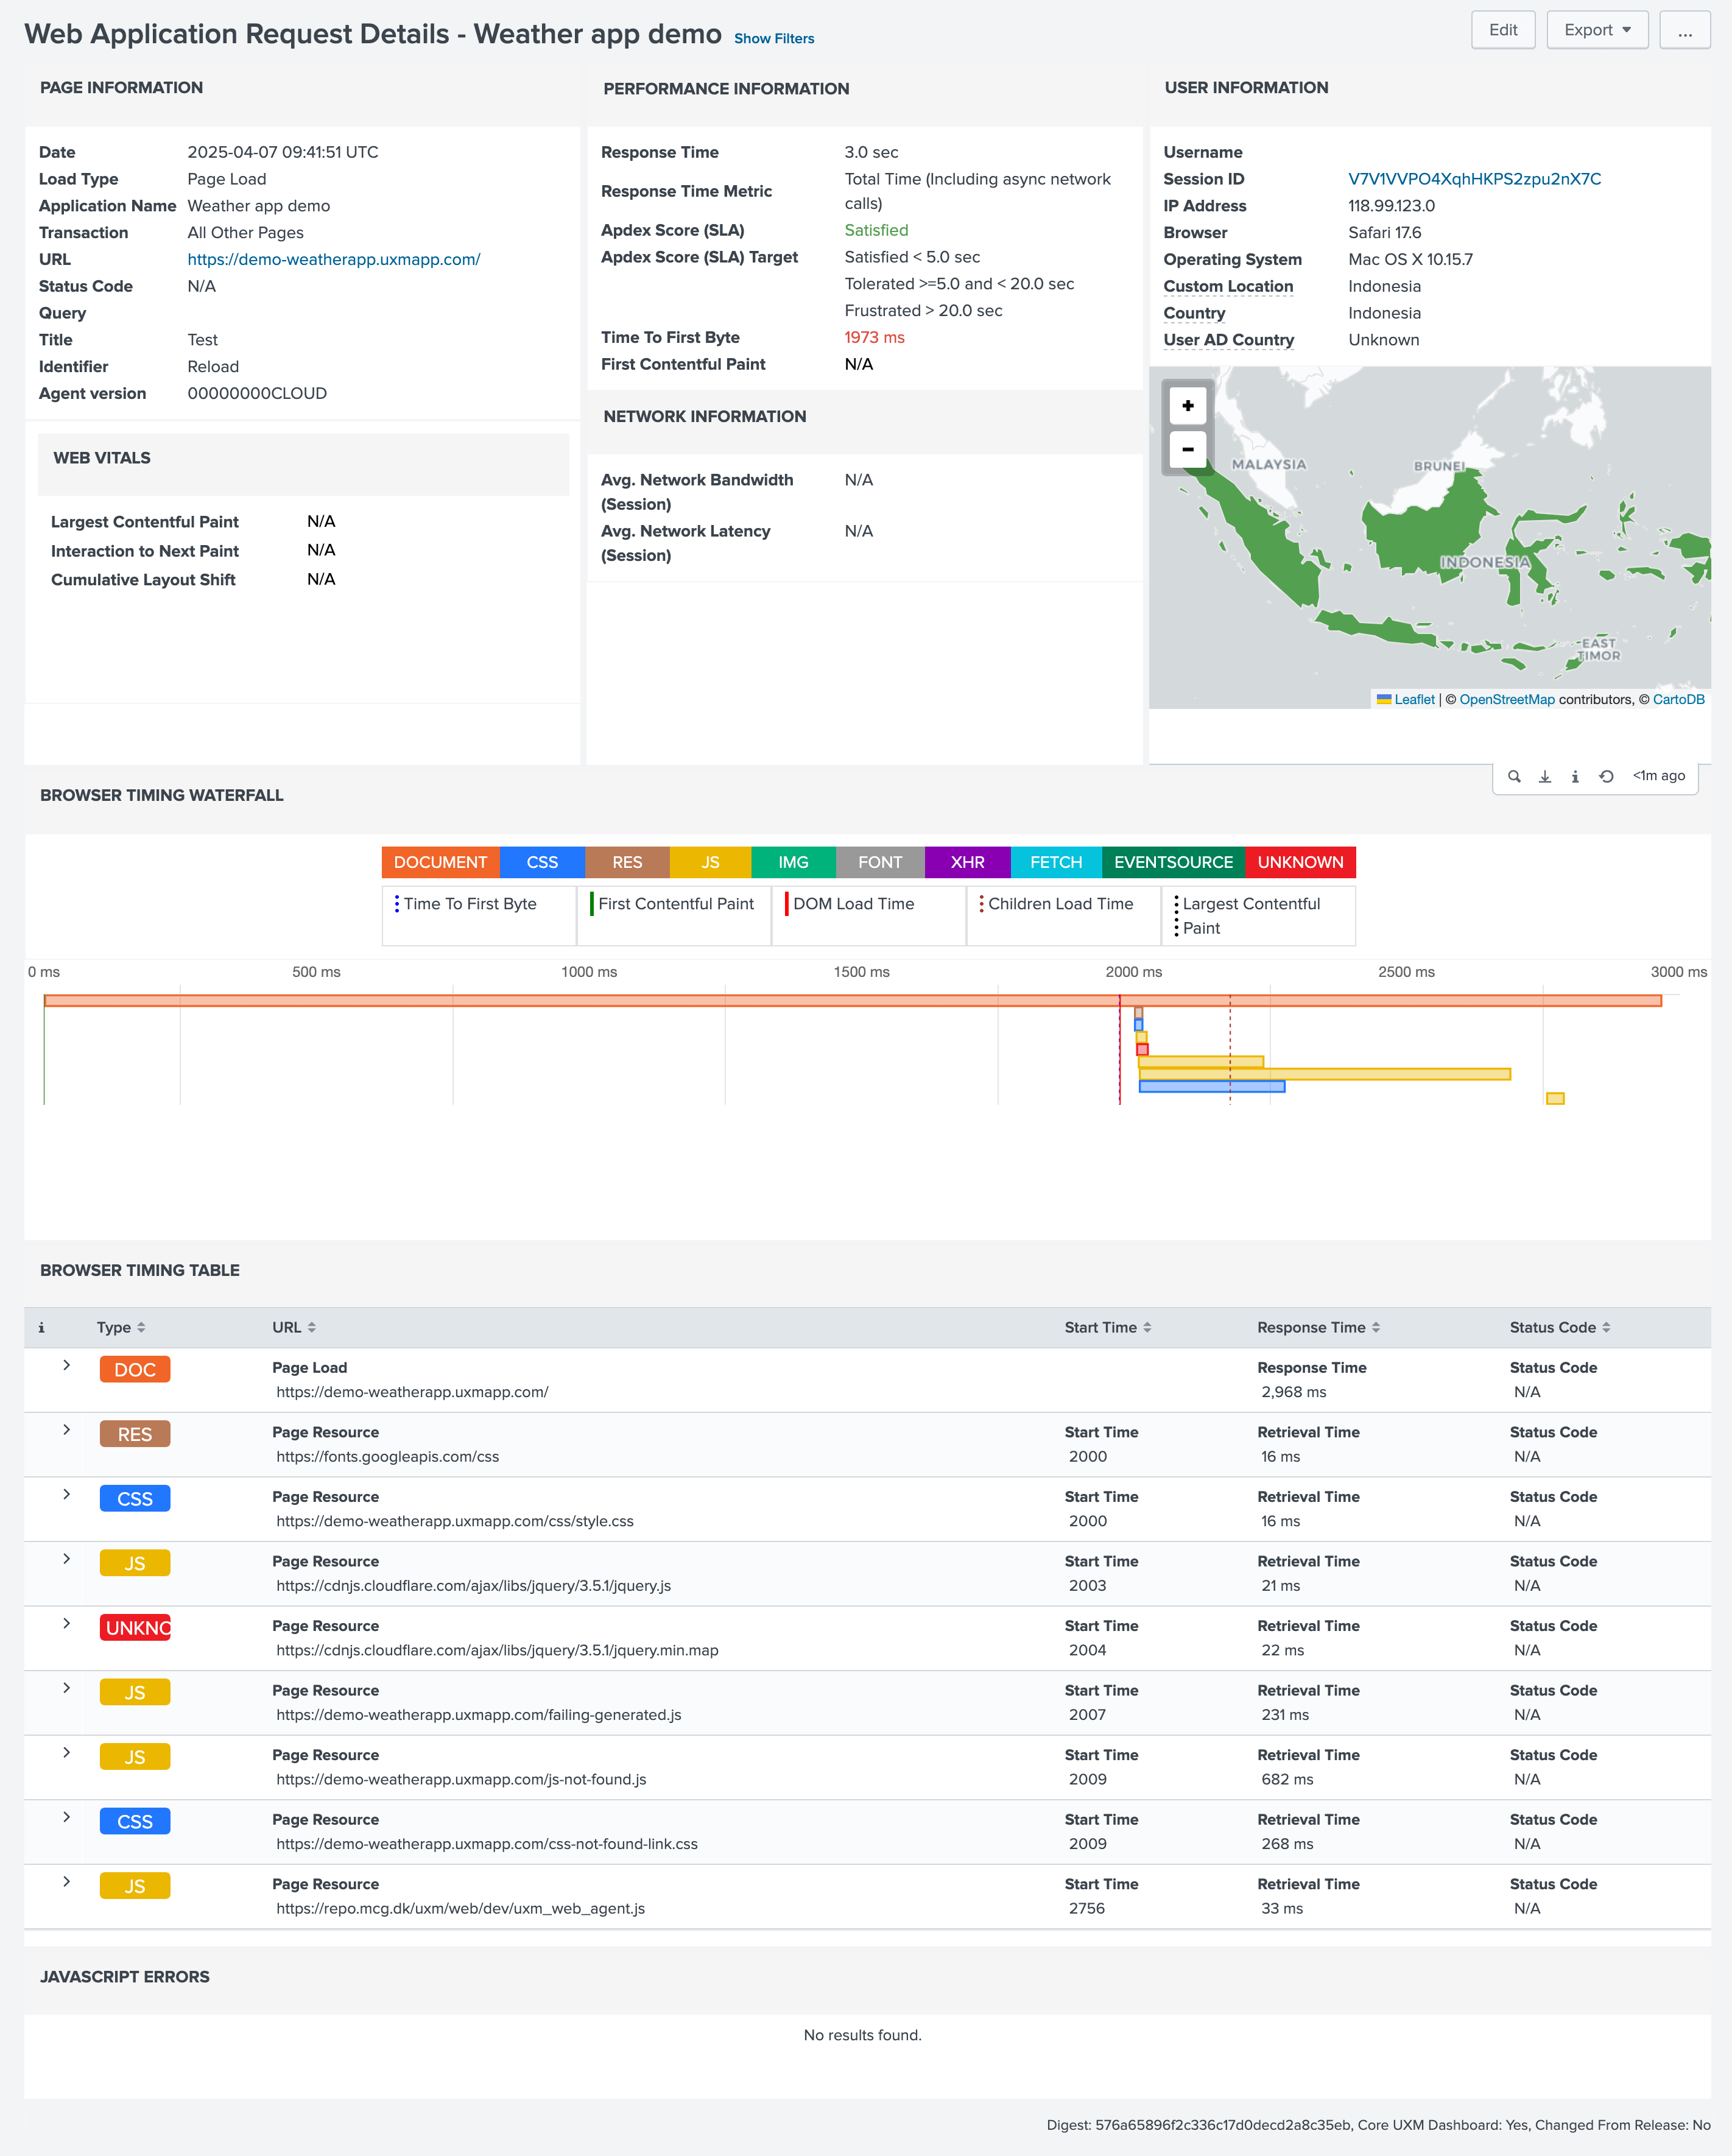
Provides an in-depth analysis of that individual request, offering a comprehensive view of its performance, user context, and network characteristics.

Metrics
- Page Information: This section details the fundamental attributes of the request, including the date and time, load type, application name, transaction type, URL, query parameters, title, identifier, and agent version.
- Performance Information: Here, key performance metrics are displayed, such as response time, response time metric, Apdex score, and Apdex score targets.
- Network Information: This section displays the average network bandwidth and average network latency for the session.
- User Information: This section provides context about the user who made the request, including username, session ID, IP address, browser, operating system, custom location, country, and User AD Country. A map visually represents the user's location.
- Browser Timing Waterfall: This visual representation breaks down the request lifecycle, showing the timing of various events like "Time To First Byte," "First Contentful Paint," "DOM Load Time," and "Children Load Time," categorized by resource types (DOCUMENT, CSS, RES, IMG, FONT, XHR, FETCH, EVENTSOURCE, UNKNOWN).
- Browser Timing Table: A table provides more specific details about the XHR (XMLHttpRequest) request, including URL, start time, response time, and status code.
- JavaScript Errors: This section indicates if there are any JavaScript errors found for this request.
In essence, this page consolidates all relevant information about a specific web request, empowering users to identify performance bottlenecks, understand user behaviour, and troubleshoot issues effectively.