Application Crashes & Hangs
The Dashboard is an invaluable resource for IT professionals overseeing enterprise desktop client estates. It facilitates real-time monitoring and analysis of application stability, offering insights into crashes/hangs and usage patterns.
This empowers support teams to swiftly identify, troubleshoot, and rectify issues, thus maintaining business continuity and ensuring a seamless operational flow.
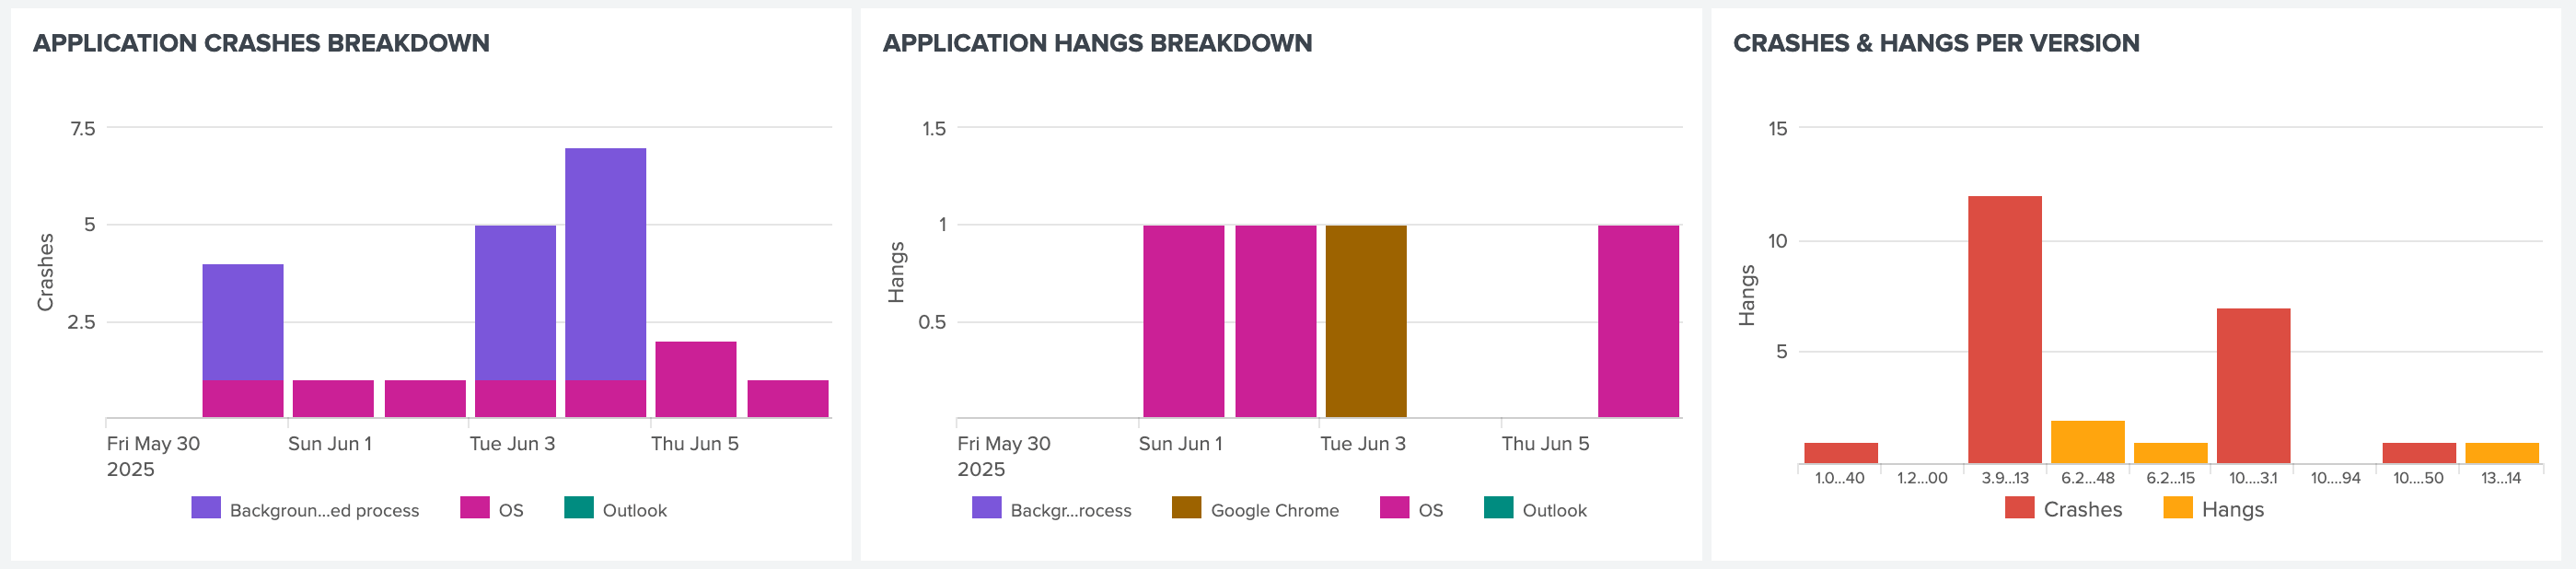
Application Crashes Breakdown
It is used to monitor and analyze application stability, identify problematic applications, and track the effectiveness of fixes or updates aimed at reducing crashes.
The graph displays the number of crashes experienced by various applications over a specific time period. The vertical axis indicates the number of crashes, while the horizontal axis denotes the timeline. Each coloured segment within the bars represents a different application, as indicated by the legend at the bottom.
By visualizing crash trends, IT professionals can proactively address issues, improve software quality, and ensure a smoother user experience.
Application Hangs Breakdown
This graph helps monitor application responsiveness and stability. It visually displays the number of times various applications experienced hangs or freezes over a specific time period.
The vertical axis represents the number of hangs. The horizontal axis shows the timeline across the mentioned dates. Each coloured segment within the bars corresponds to a different application, with a legend provided at the bottom for identification.
By tracking hangs, IT teams can identify applications that are frequently freezing or becoming unresponsive, potentially indicating performance issues or software bugs.
Crashes & Hangs per Version
It displays the number of crashes and hangs for different application versions. It shows a count of these incidents for each version, allowing for quick visual comparison. The red bars represent crashes, and the yellow bars represent hangs.
This helps identify problematic versions needing attention.
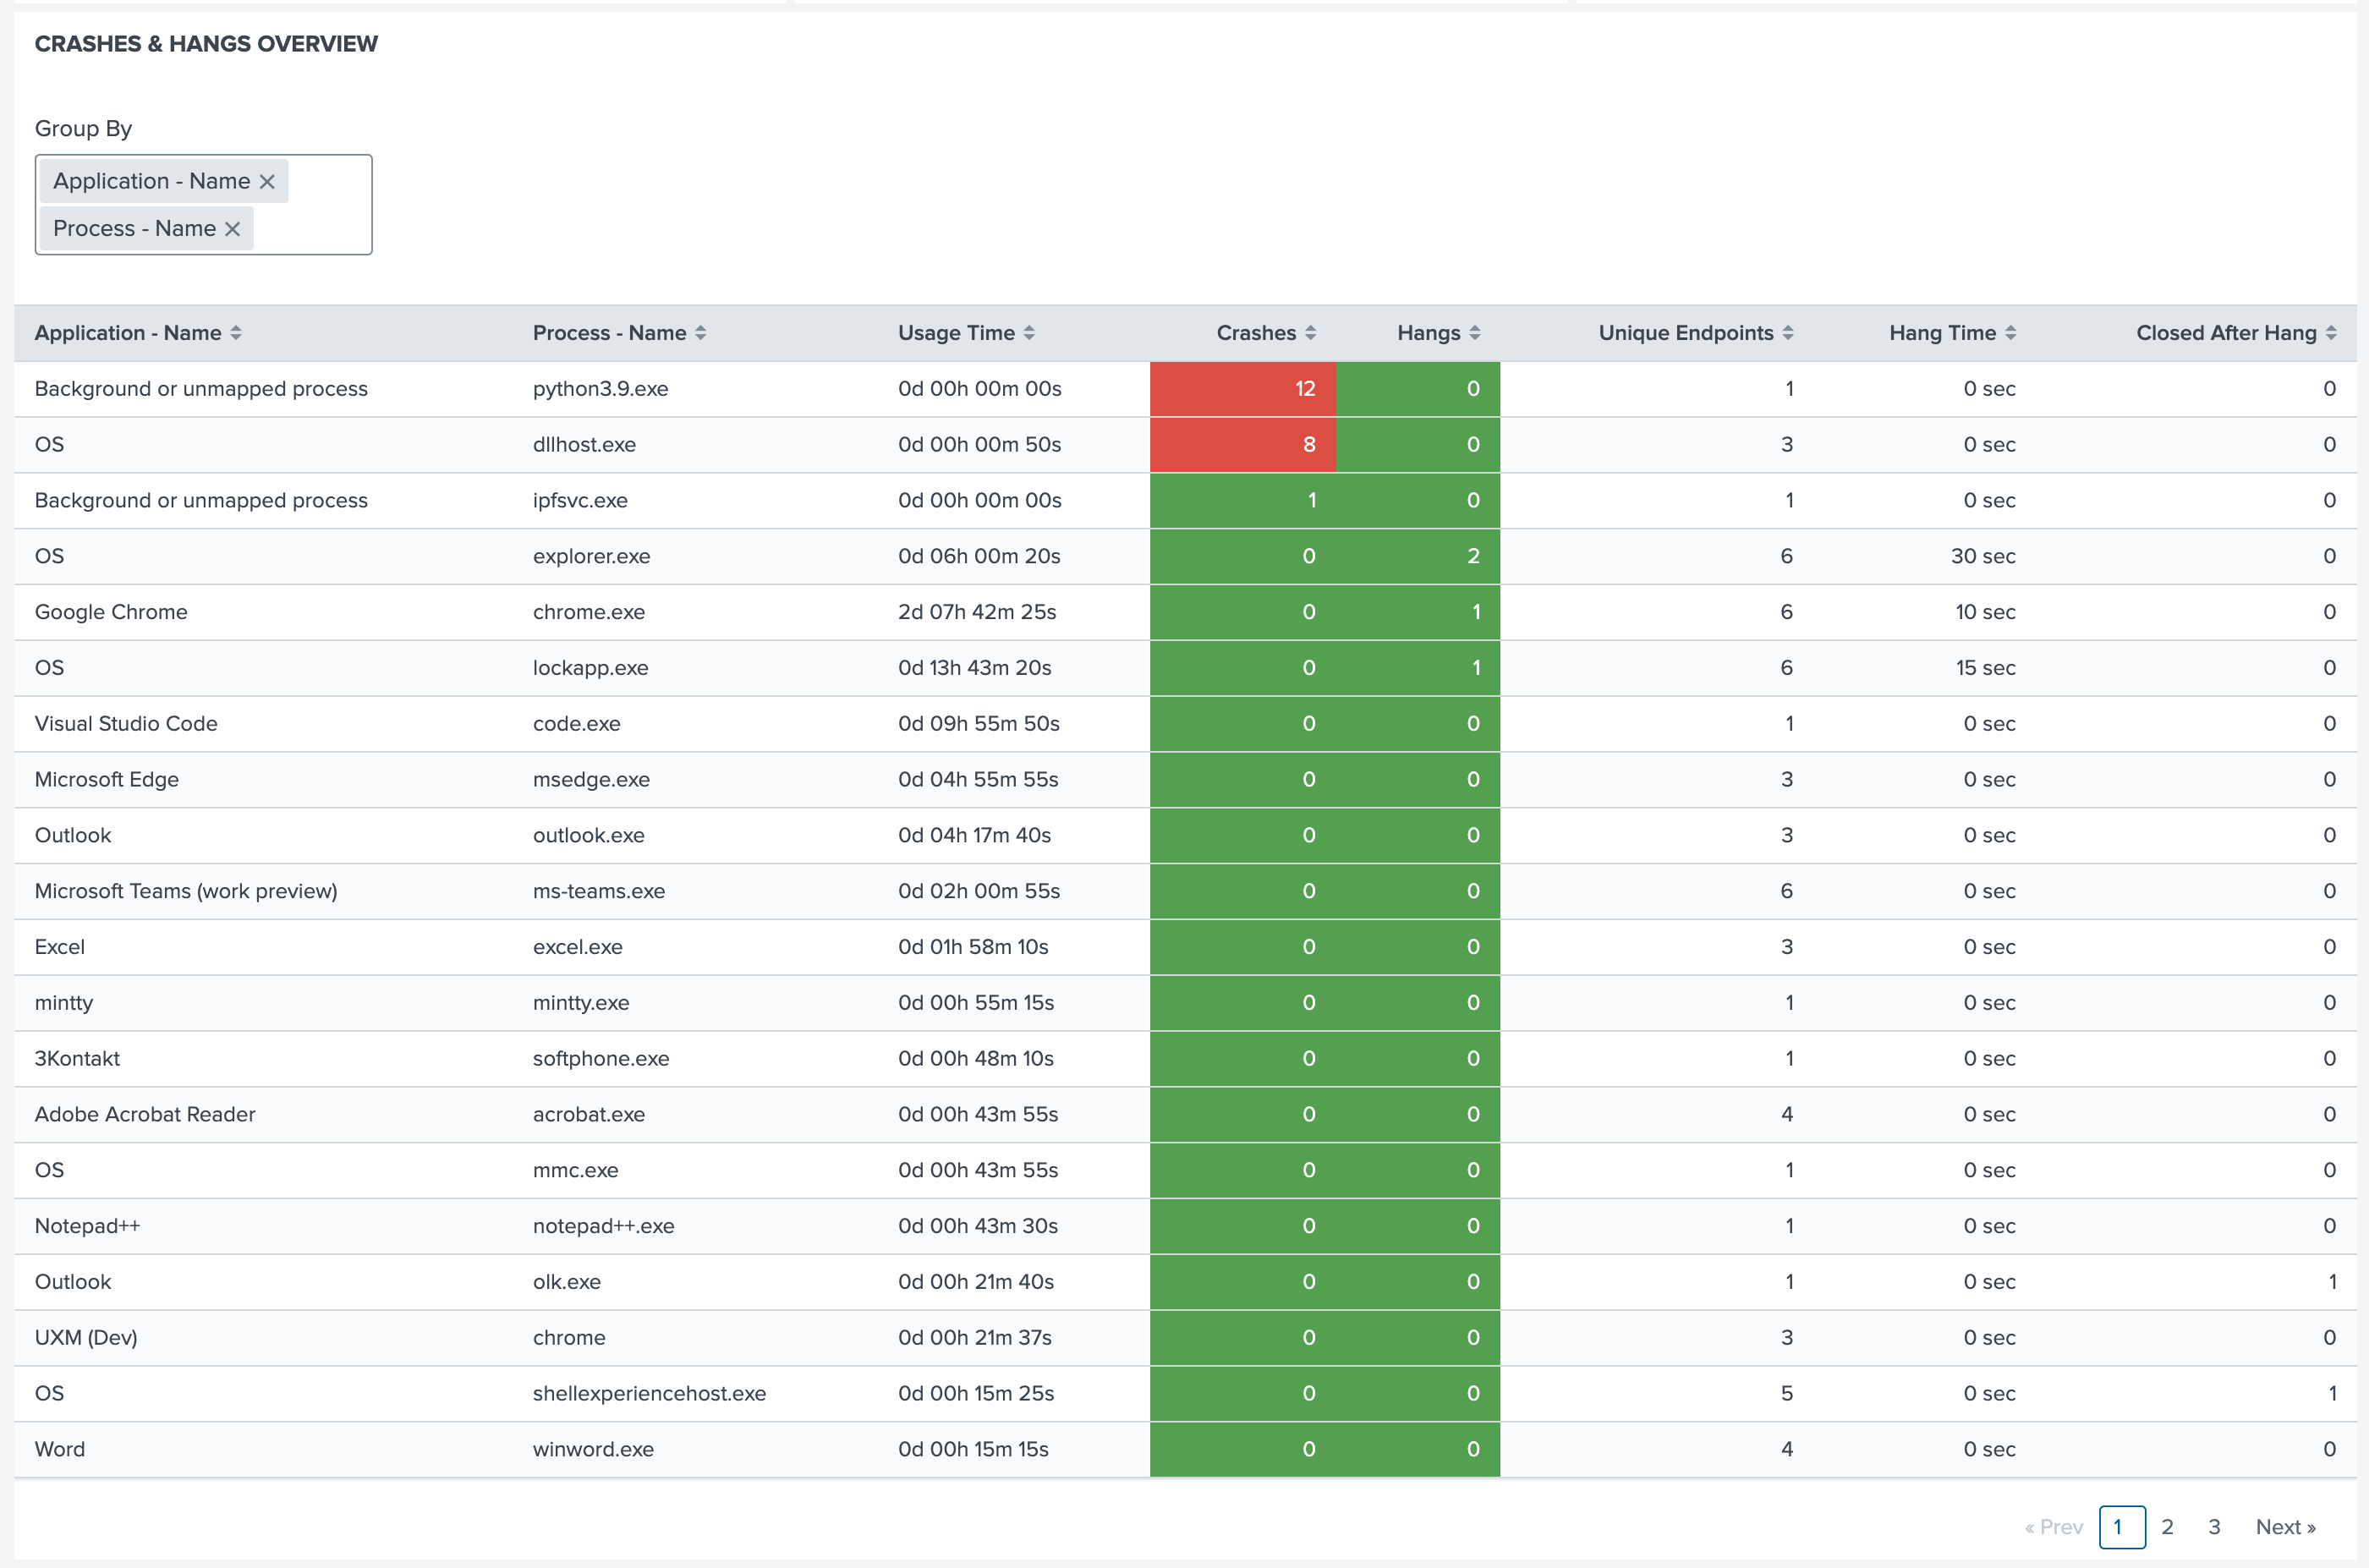
Crashes & Hangs Overview
Details application and process performance, specifically crashes and hangs, across different versions. Users can add more column in the table from ‘Group By’ section.
The table presents usage time alongside the counts of crashes and hangs, offering context for incident frequency.
Additionally, it tracks unique endpoints affected, hang duration, and whether a program closed after a hang. This data helps pinpoint problematic applications and versions for troubleshooting and resolution, prioritizing fixes based on impact and frequency.
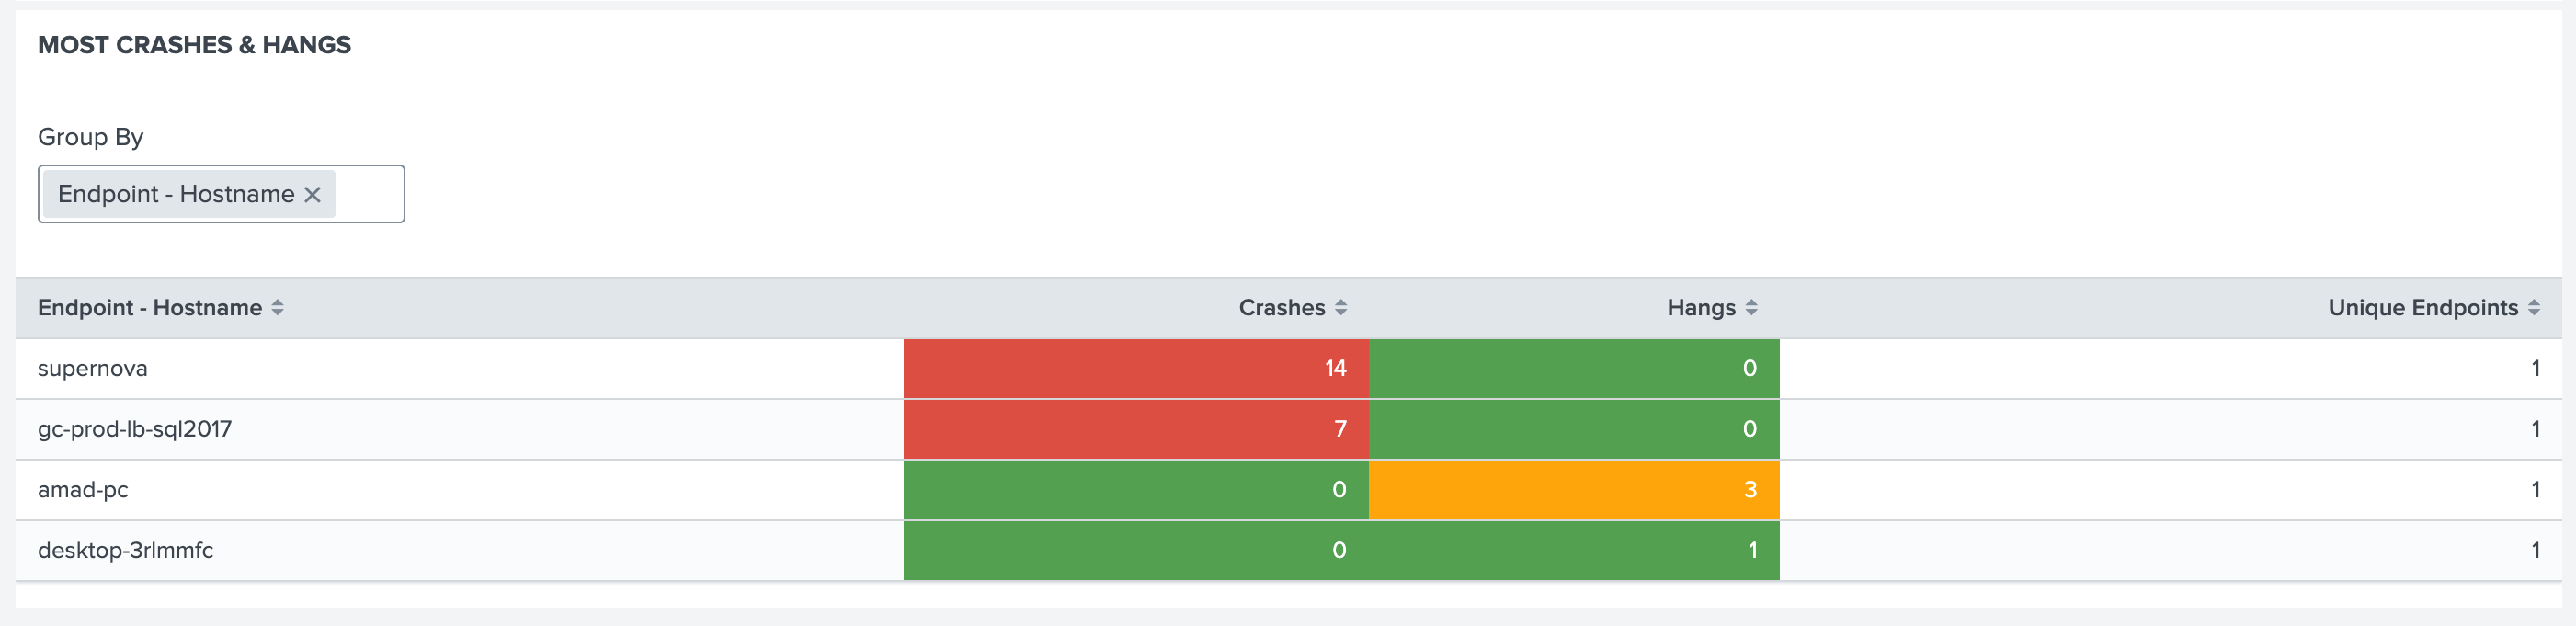
Most Crashes & Hangs
Displays endpoints (devices) with the highest instability, grouped by hostname. Each row represents a unique device, showing its name, number of crashes, hangs, and confirming it as a single unique endpoint. Color-coded rows highlight severity: red for high, orange for moderate, and green for low issues.
This allows for quick identification of problematic devices requiring immediate troubleshooting. Additional columns can be added from Group by selection.
Exporting Data
The dashboard enables data to be exported for thorough analysis and archival, promoting detailed scrutiny and historical record management.