Endpoints Details
The dashboard provides a technical summary of a monitored endpoint device, displaying key identifiers such as device name, agent version, and registration timestamp.
The dashboard is organized into 10 distinct tabs:
- Summary
- Score
- Performance
- Drives
- Boot Speed
- Events
- Crashes
- Application Usage
- Installed Programs
- Devices
Each tab provides specialized insights into different aspects of the endpoint's operation, allowing users to quickly navigate between system metrics, performance data, installed software, and hardware details for comprehensive monitoring and analysis.
Summary
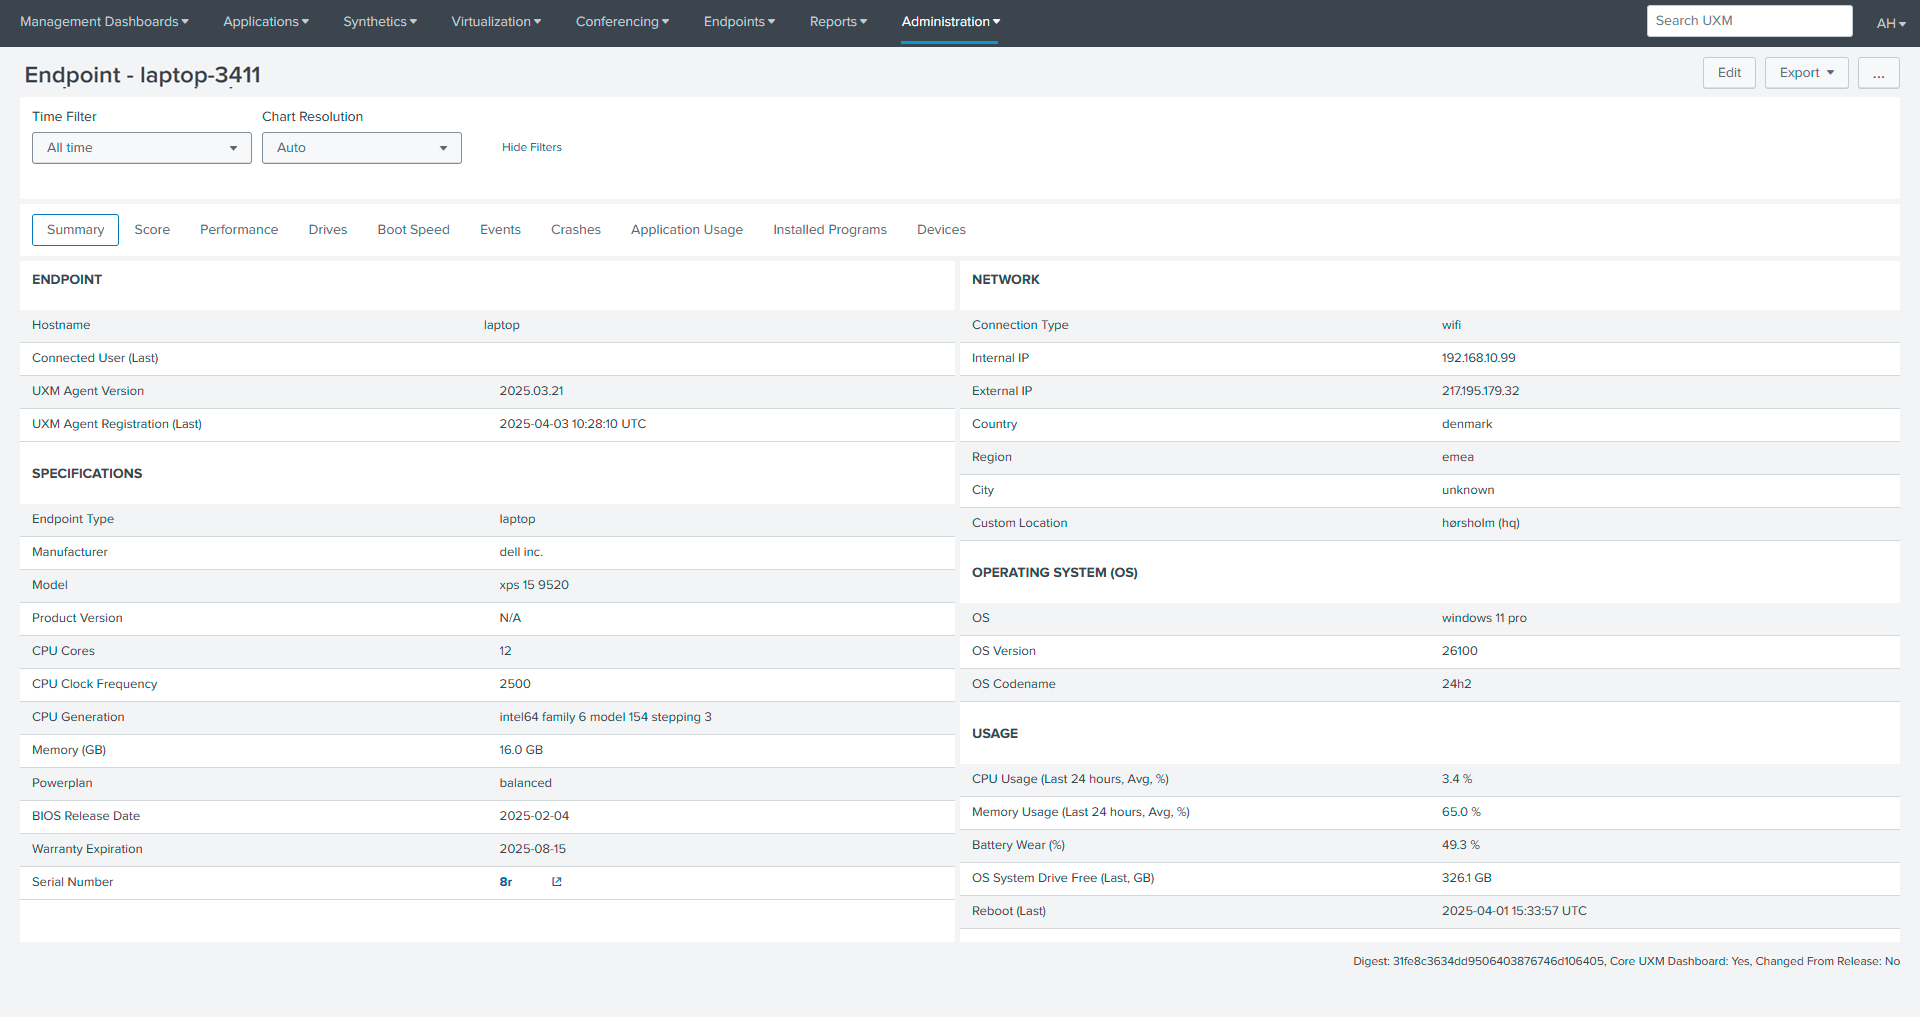
Specifications
This section outlines the hardware configuration, including manufacturer, model, processor details (family, generation, and clock speed), installed memory, power settings, and warranty information.
Network Information
Network connectivity details are displayed, covering connection type (wired/wireless), internal and external IP addresses, and approximate geographical location data.
Operating System (OS)
The dashboard shows the operating system version, build number, release codename, and installation date for the endpoint device.
Usage
This provides key insights into the device's operational status, including average CPU and memory utilization over a 24-hour period, battery health percentage indicating wear level, and available storage space on the system drive
Score
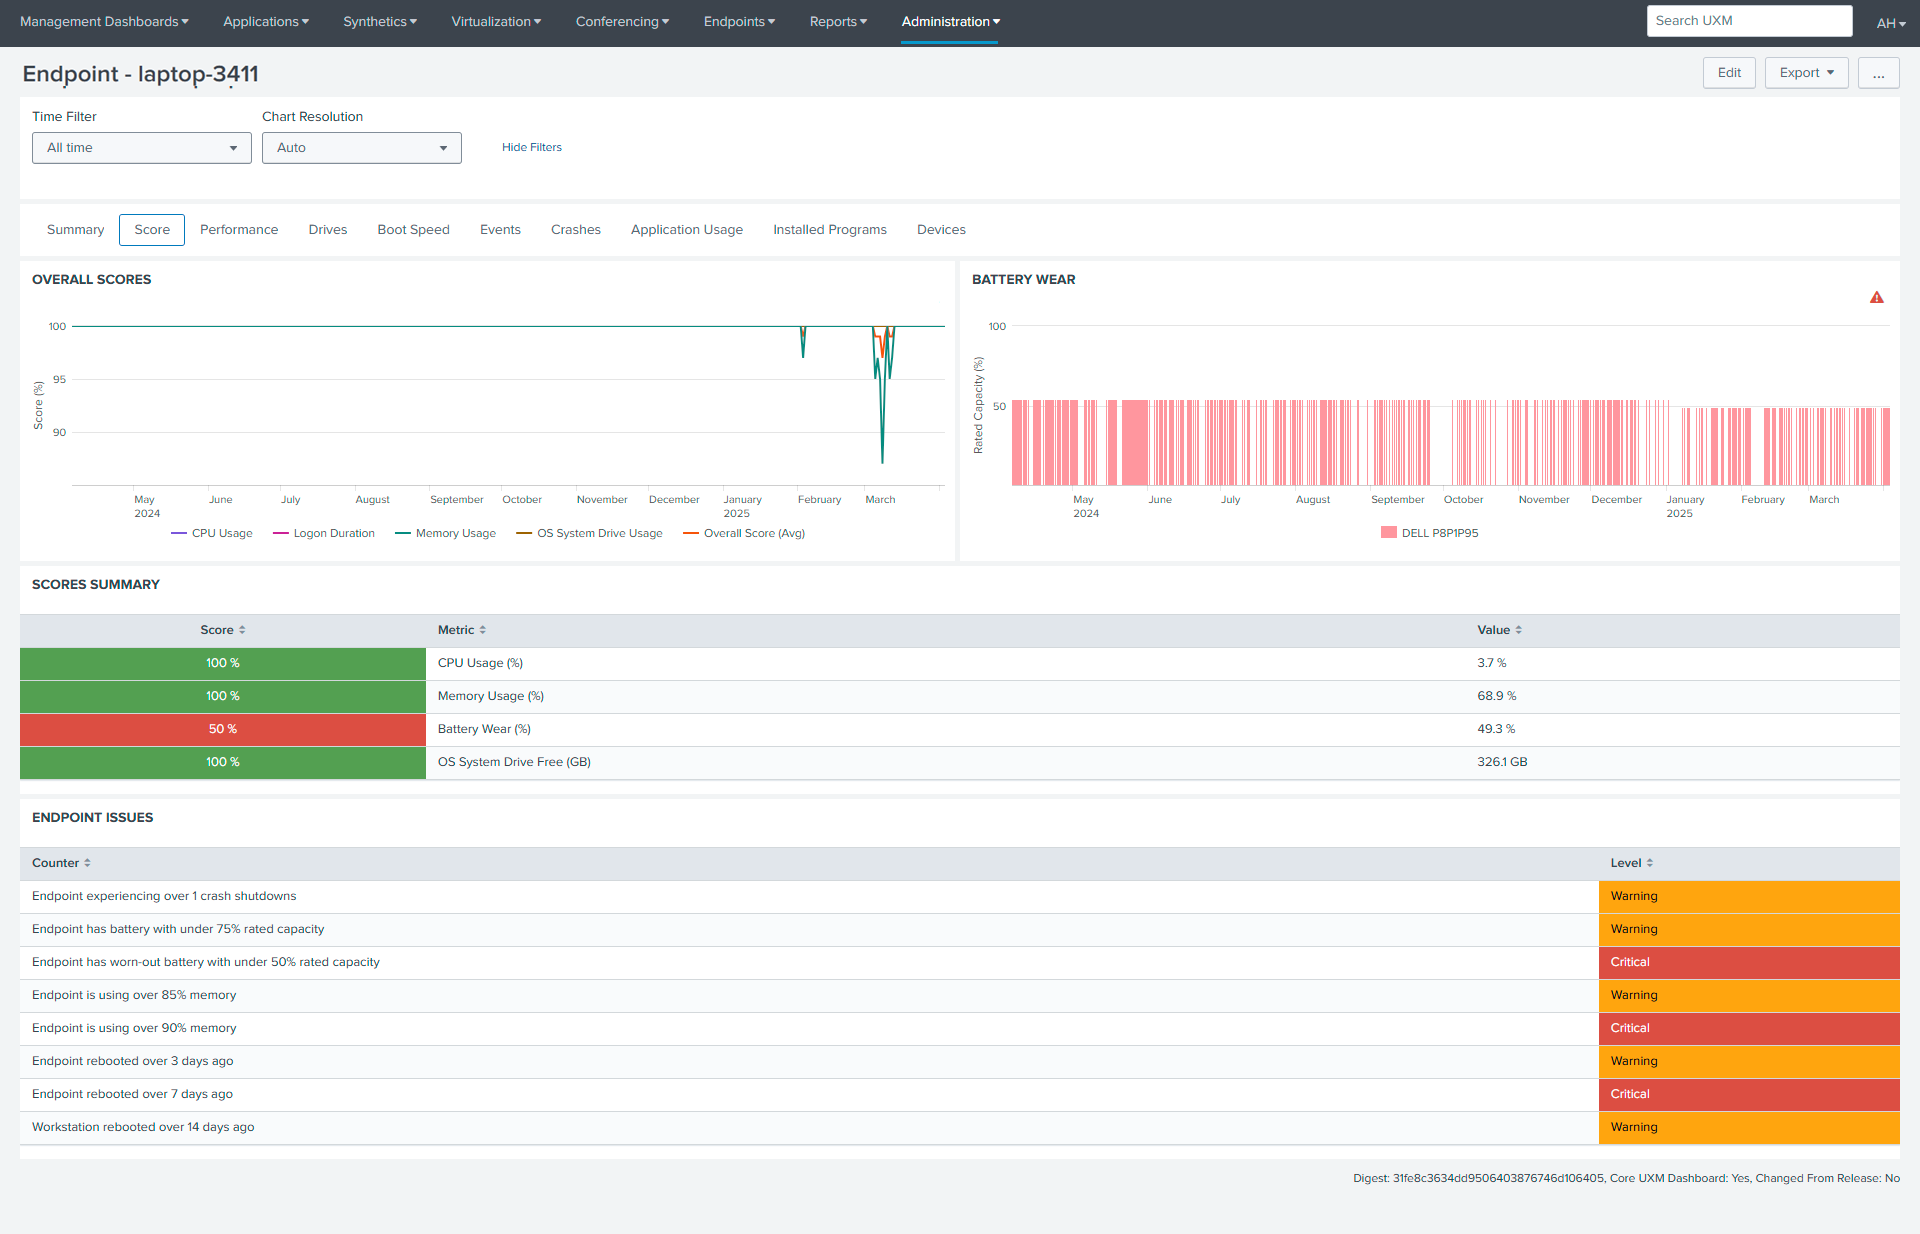
Overall Score
This section presents standardized performance metrics (labeled as KATA scores) tracking critical system components including memory utilization, battery health, and drive performance. The data appears to follow a consistent scoring methodology for comparative analysis.
Battery Wear
This dashboard displays the battery health trend over time, tracking the rated capacity percentage.Its primary function is to help IT administrators and support teams visualize battery health patterns, enabling them to anticipate when batteries might need replacement before performance issues like sudden shutdowns occur.By showing the progression of battery wear, the dashboard supports proactive maintenance planning and helps organizations optimize their device lifecycle management.
Scores Summary
This Scores Summary dashboard provides a concise performance snapshot of key system metrics for monitoring and maintaining device health. It tracks four critical indicators: CPU usage, memory utilization, battery wear level, and available storage space on the operating system drive.
Endpoint Issue
It provides real-time information categorized as "Warnings" or "Critical," based on metrics like battery capacity, memory usage, and system uptime. This allows administrators to proactively identify and address potential issues, optimize performance, and ensure system stability, ultimately minimizing downtime and facilitating timely maintenance. The dashboard effectively acts as a proactive diagnostic tool for maintaining optimal endpoint functionality.
Performance
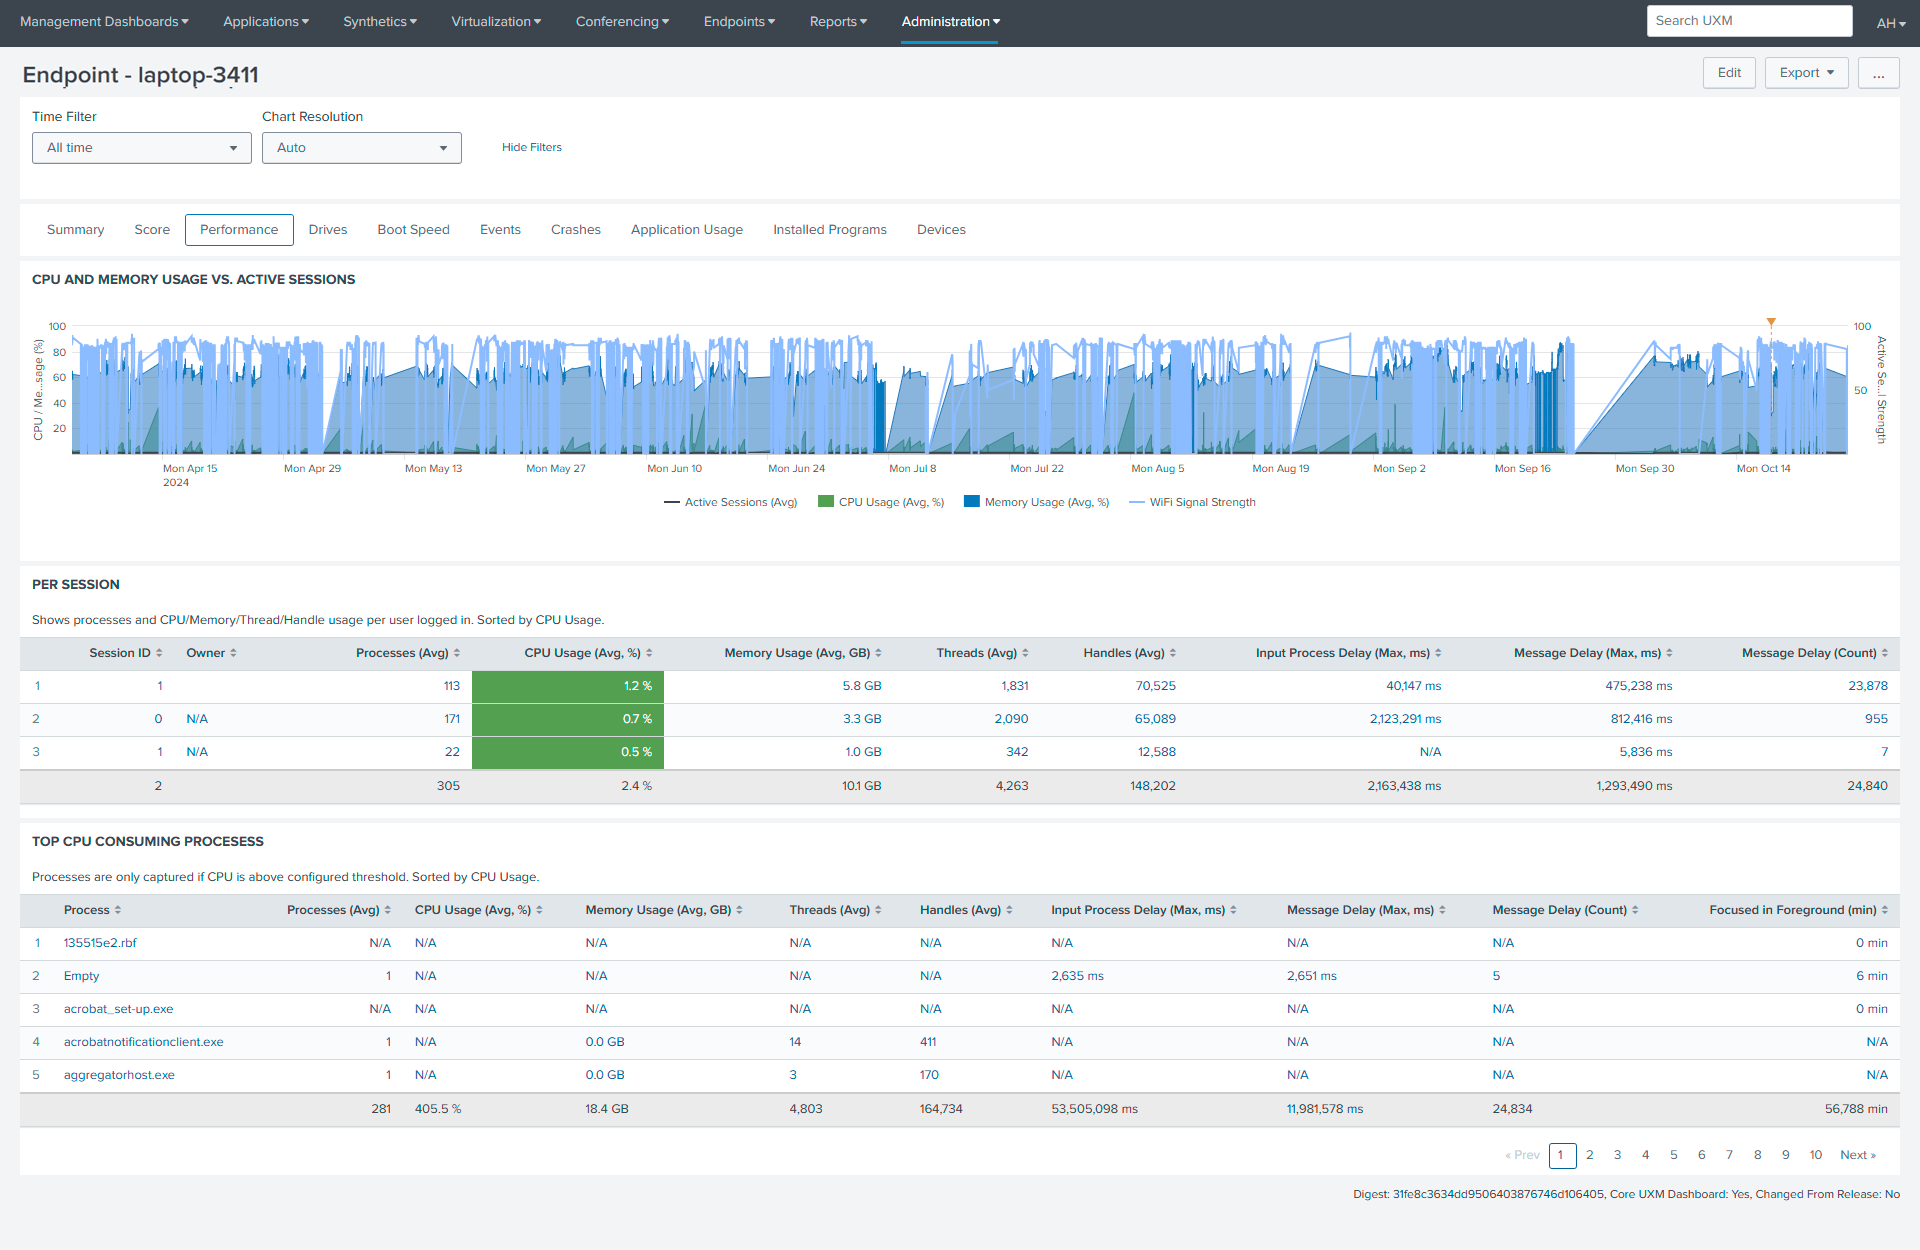
CPU and Memory Usage vs. Active Sessions
This chart provides a crucial high-level overview of system resource utilization over time. It visually correlates CPU and memory usage with the number of active sessions, revealing trends and potential bottlenecks. By observing fluctuations in these metrics, administrators can identify periods of high resource demand, understand the impact of active sessions on system performance, and proactively address potential issues before they escalate. This temporal view aids in capacity planning and optimization by highlighting patterns and correlations between resource consumption and user activity.
Per Session
This table offers a granular, session-by-session breakdown of resource consumption, enabling detailed analysis of individual session performance. It displays key metrics such as CPU and memory usage,thread counts, and input process/message delays, allowing administrators to pinpoint resource-intensive sessions and diagnose performance issues at a micro level. By identifying specific users or applications contributing to high resource utilization, targeted optimizations and troubleshooting efforts can be implemented. This detailed perspective is essential for understanding the impact of individual sessions on overall system performance.
Top CPU consuming procesess
This table focuses on identifying the processes that are consuming the most CPU resources. By listing processes with the highest CPU utilization alongside relevant metrics like memory usage, thread counts, and delays, it allows administrator for prompt investigation into the root cause of high CPU usage and the implementation of corrective actions, such as terminating or optimizing resource-hungry processes. This proactive approach ensures efficient resource allocation and minimizes the impact of resource-intensive processes on overall system performance.
Drives
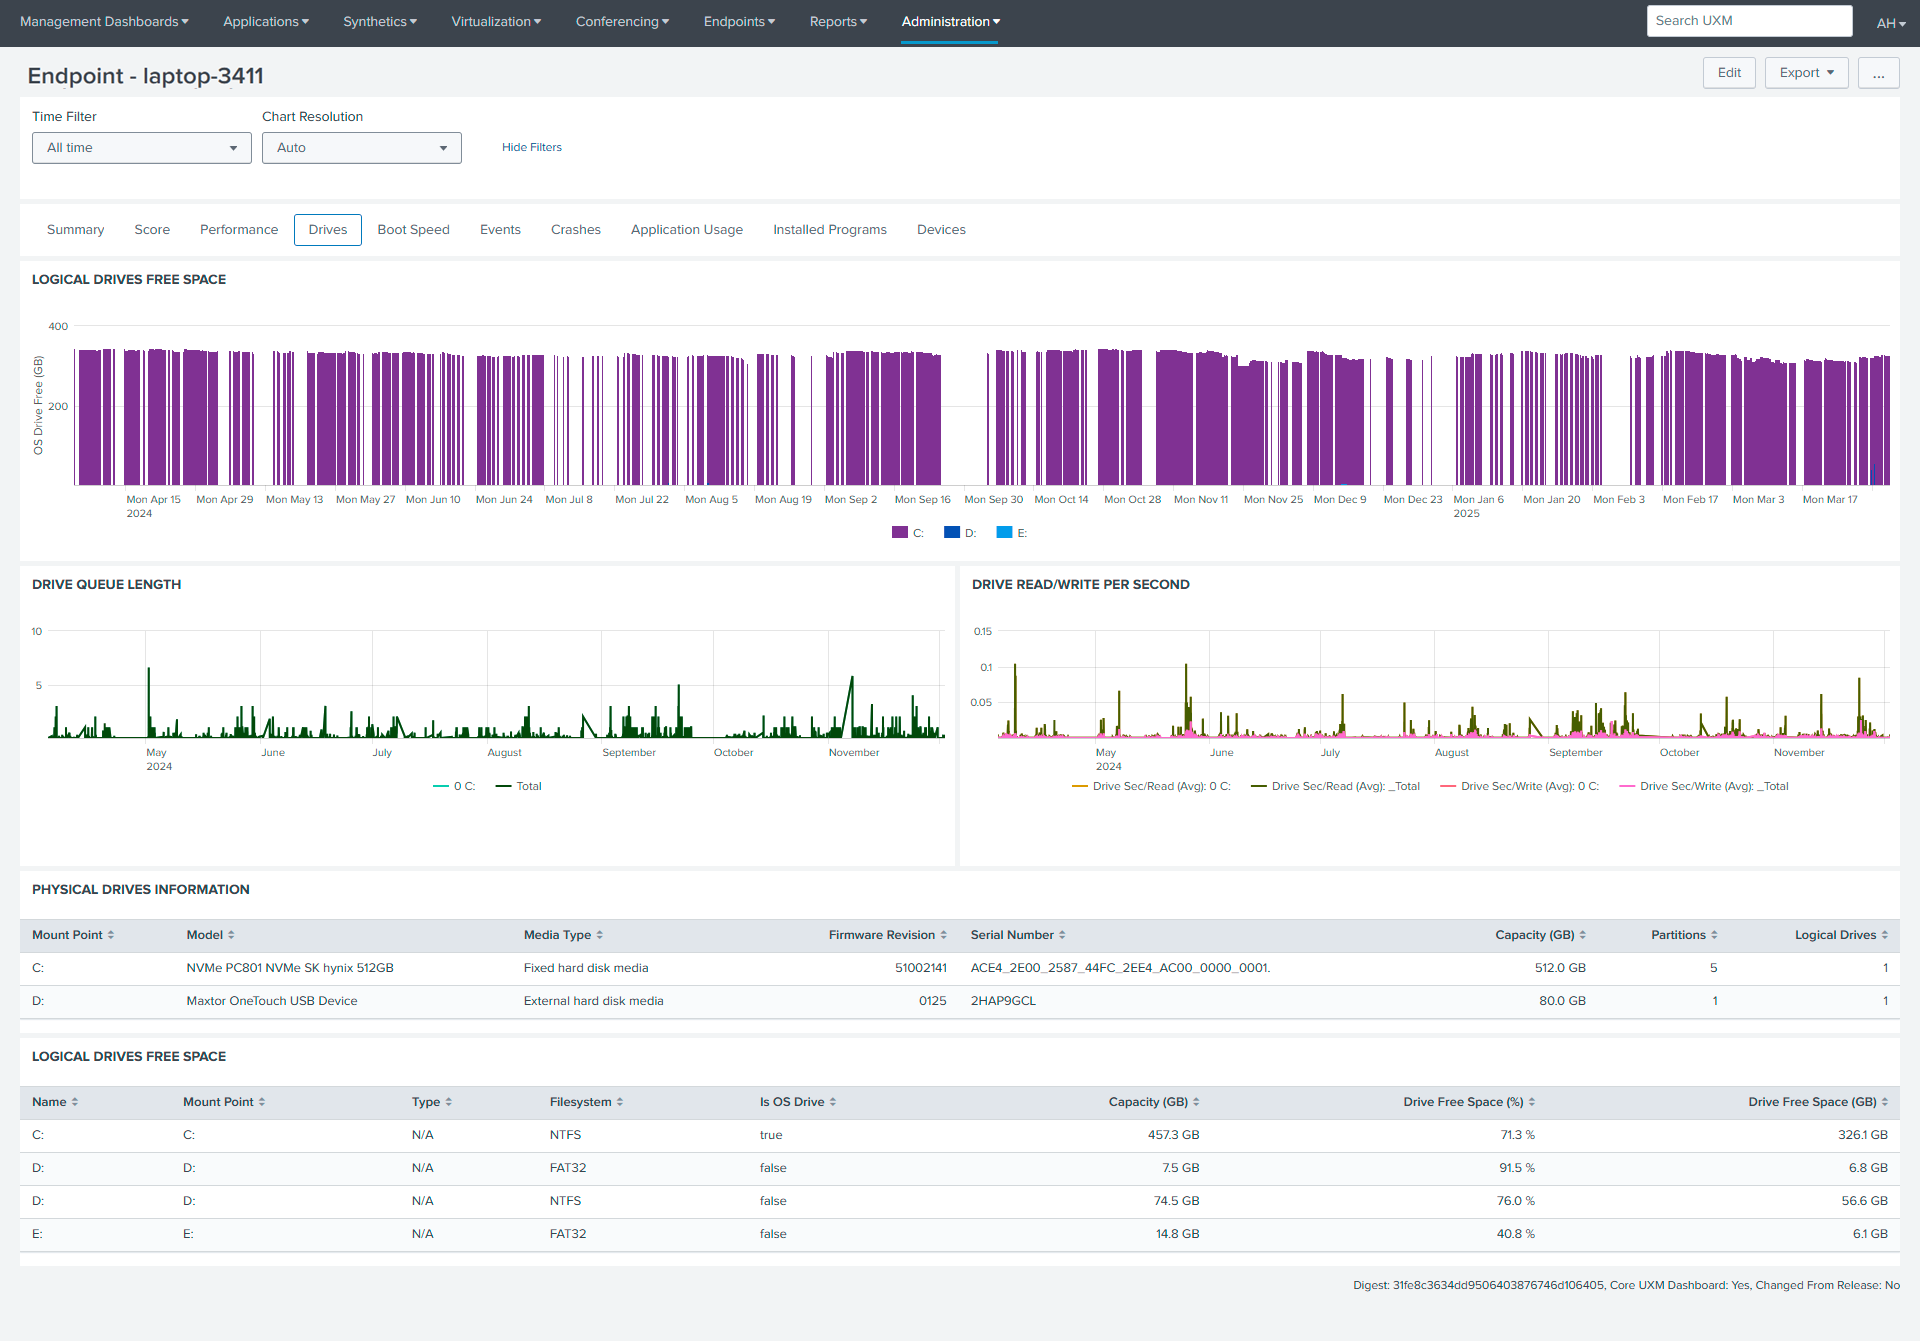
Logical Drive Free Space
This chart offers a time-based visualization of the free space available on each logical drive within the endpoint. It allows administrators to quickly assess storage capacity over a selected period, identify potential issues with drives nearing full capacity, and observe trends in storage usage.
Drive Queue Length
The Drive Queue Length chart monitors the number of pending read/write requests to the drive, providing a real-time indication of drive load. High queue lengths can signal potential bottlenecks, suggesting the drive is struggling to keep up with I/O demands, while low queue lengths indicate efficient operation.
Drive Read/Write Per Second
This chart displays the I/O throughput of the drive, measuring the number of read and write operations performed per second. It offers insights into the drive's performance and data transfer rates, with high throughput indicating efficient operation and low throughput suggesting potential performance issues.
Physical Drives Information
This table provides detailed specifications of the physical drives installed in the endpoint. It includes information such as model, media type, firmware version, capacity, and the number of logical drives on each physical drive, facilitating inventory management, troubleshooting, and understanding the hardware configuration.
Logical Drives Free Space
The Logical Drives Free Space table offers a granular view of each logical drive's storage utilization. It details the drive's name, mount point, file system type, capacity, and the percentage and amount of free space, enabling precise storage management and proactive monitoring for potential space constraints
Boot Speed
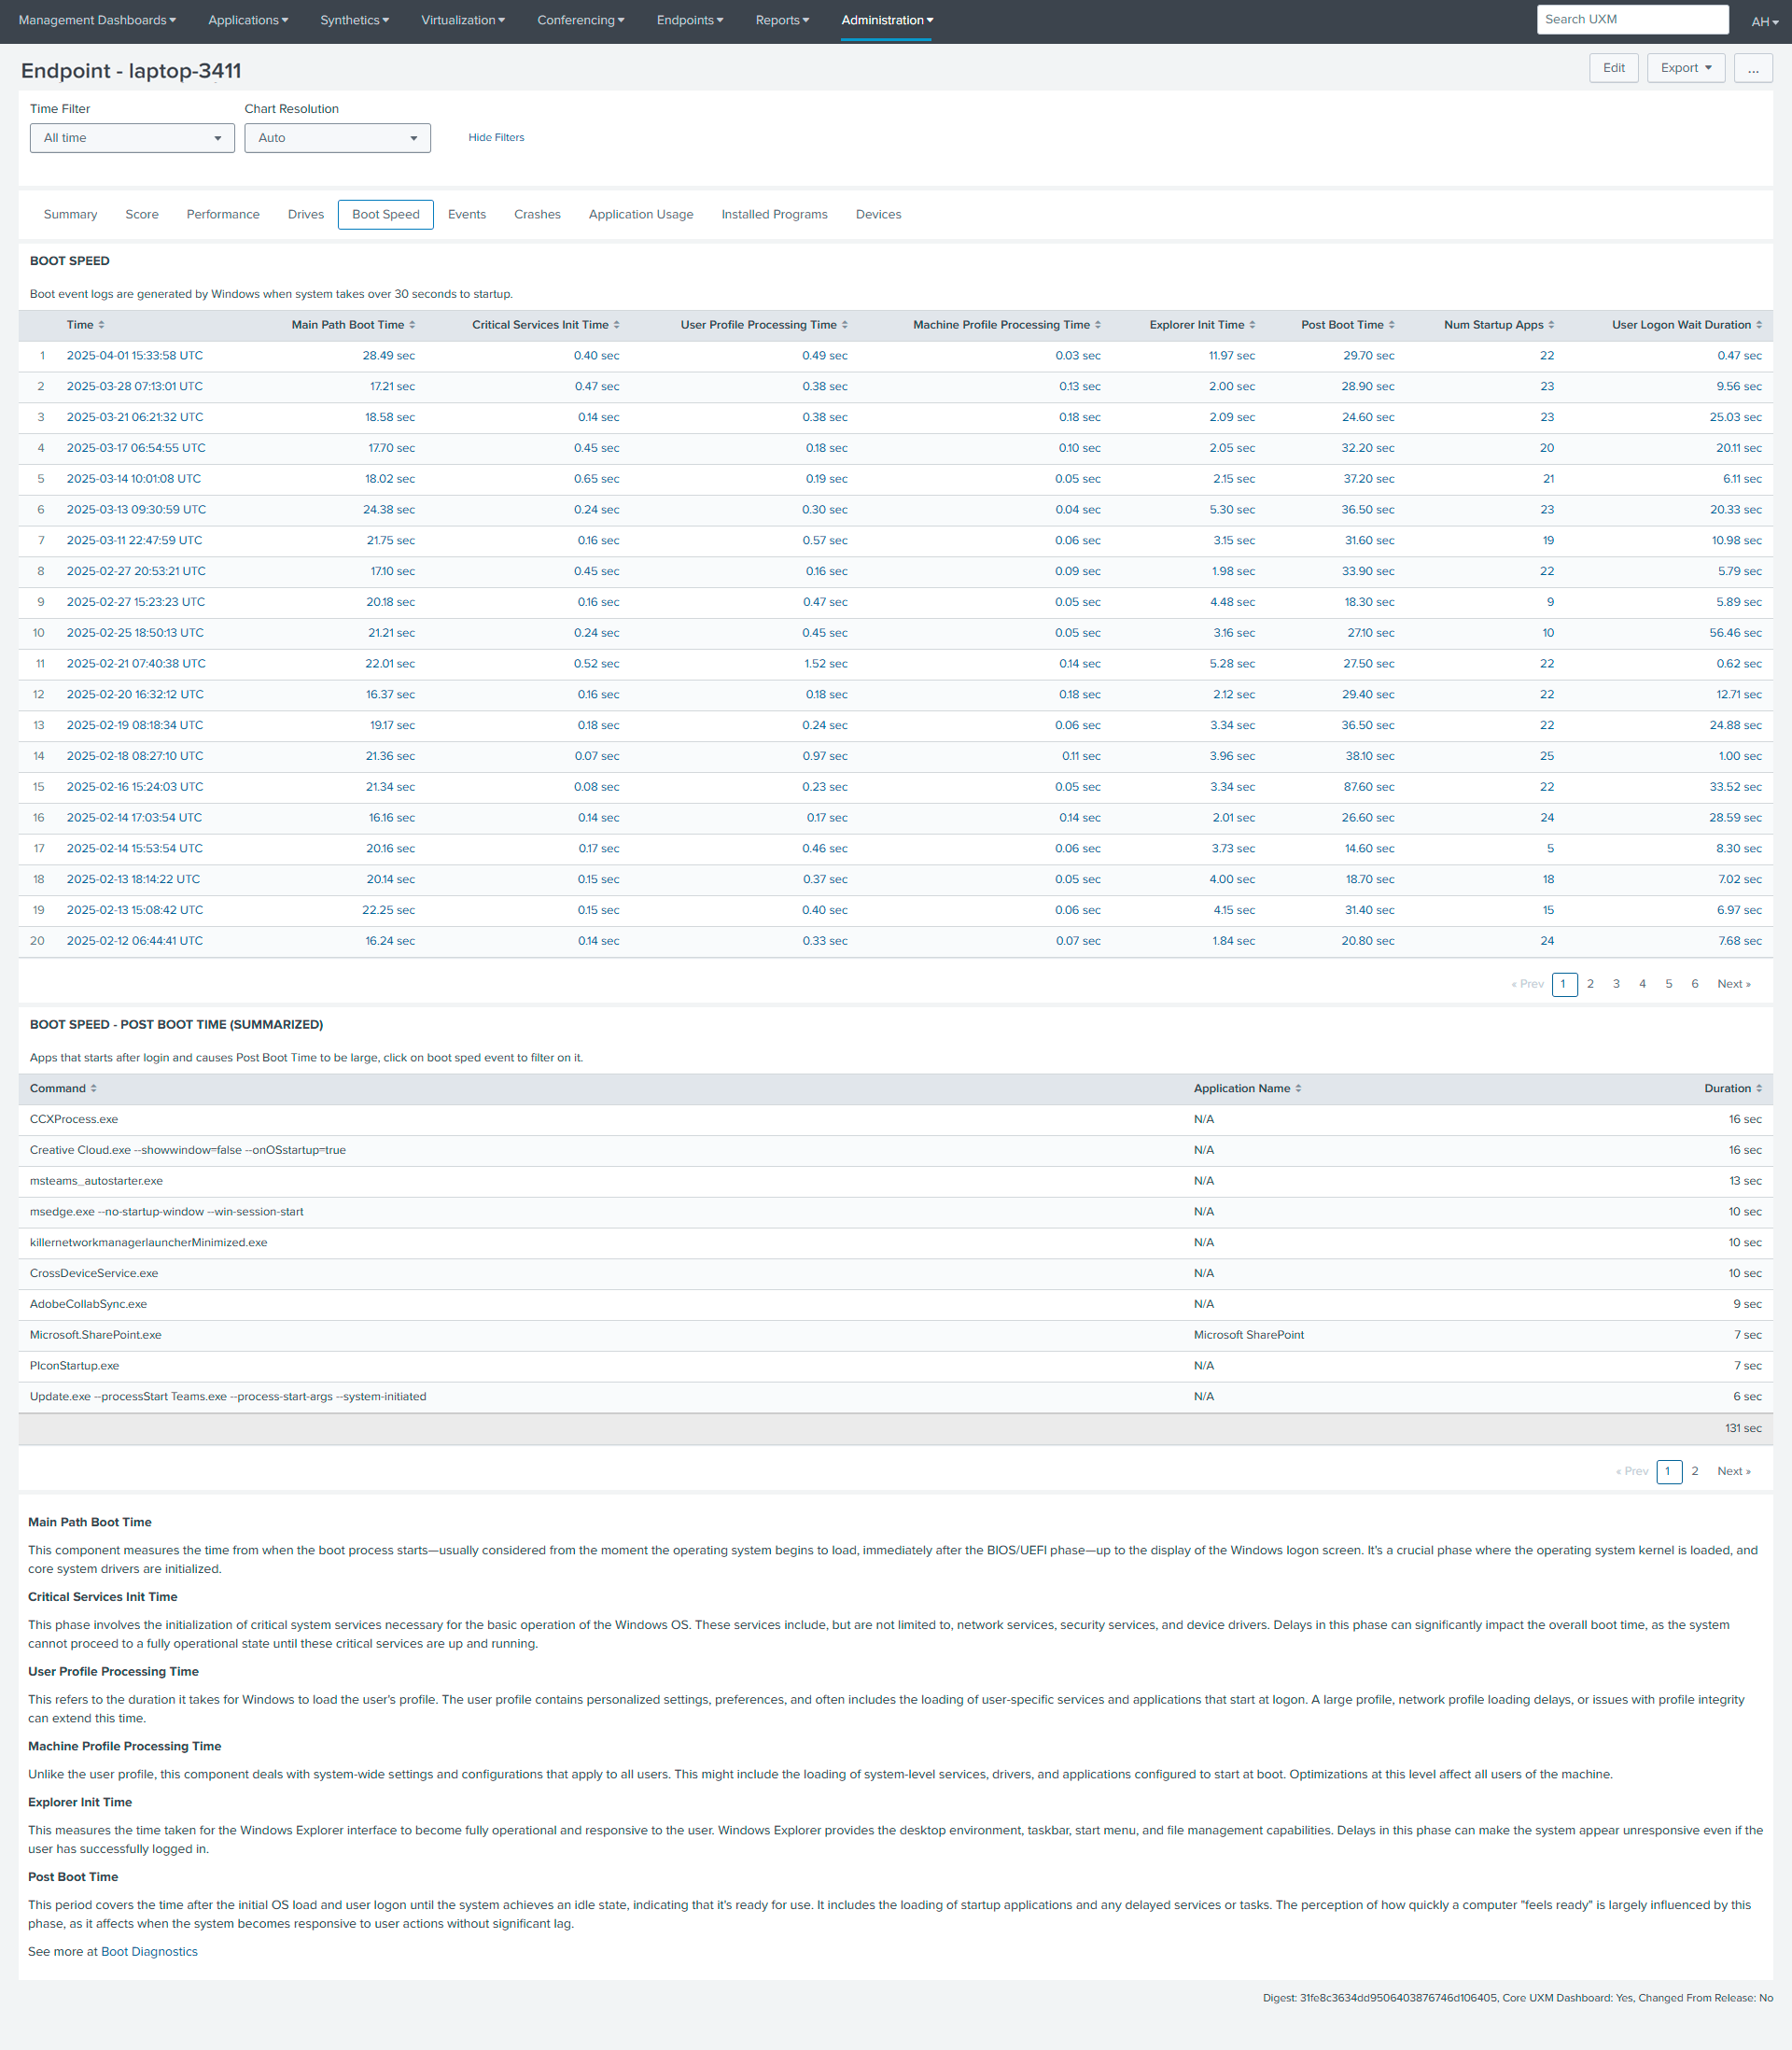
Boot Speed
The Boot Speed table provides a comprehensive overview of each boot event, capturing various timing metrics from pre-session initialization to post-boot activities. This detailed data enables administrators to pinpoint specific areas contributing to slow boot times, such as user profile processing or virtual services initialization.
Boot Speed - Post Boot Time (Summary):
This table summarizes the commands and applications launched during post-boot, highlighting their execution times. By identifying applications with high durations, administrators can optimize startup processes and troubleshoot post-boot delays, ensuring a smoother and faster user experience.
Explanatory Text Below the Post Boot Table:
The explanatory text section provides definitions for the various boot timing metrics presented in the tables, offering crucial context for interpreting the performance data. By explaining each stage of the boot process, from critical services initialization to user profile processing, this section helps users understand the data and effectively troubleshoot boot performance issues.
Events
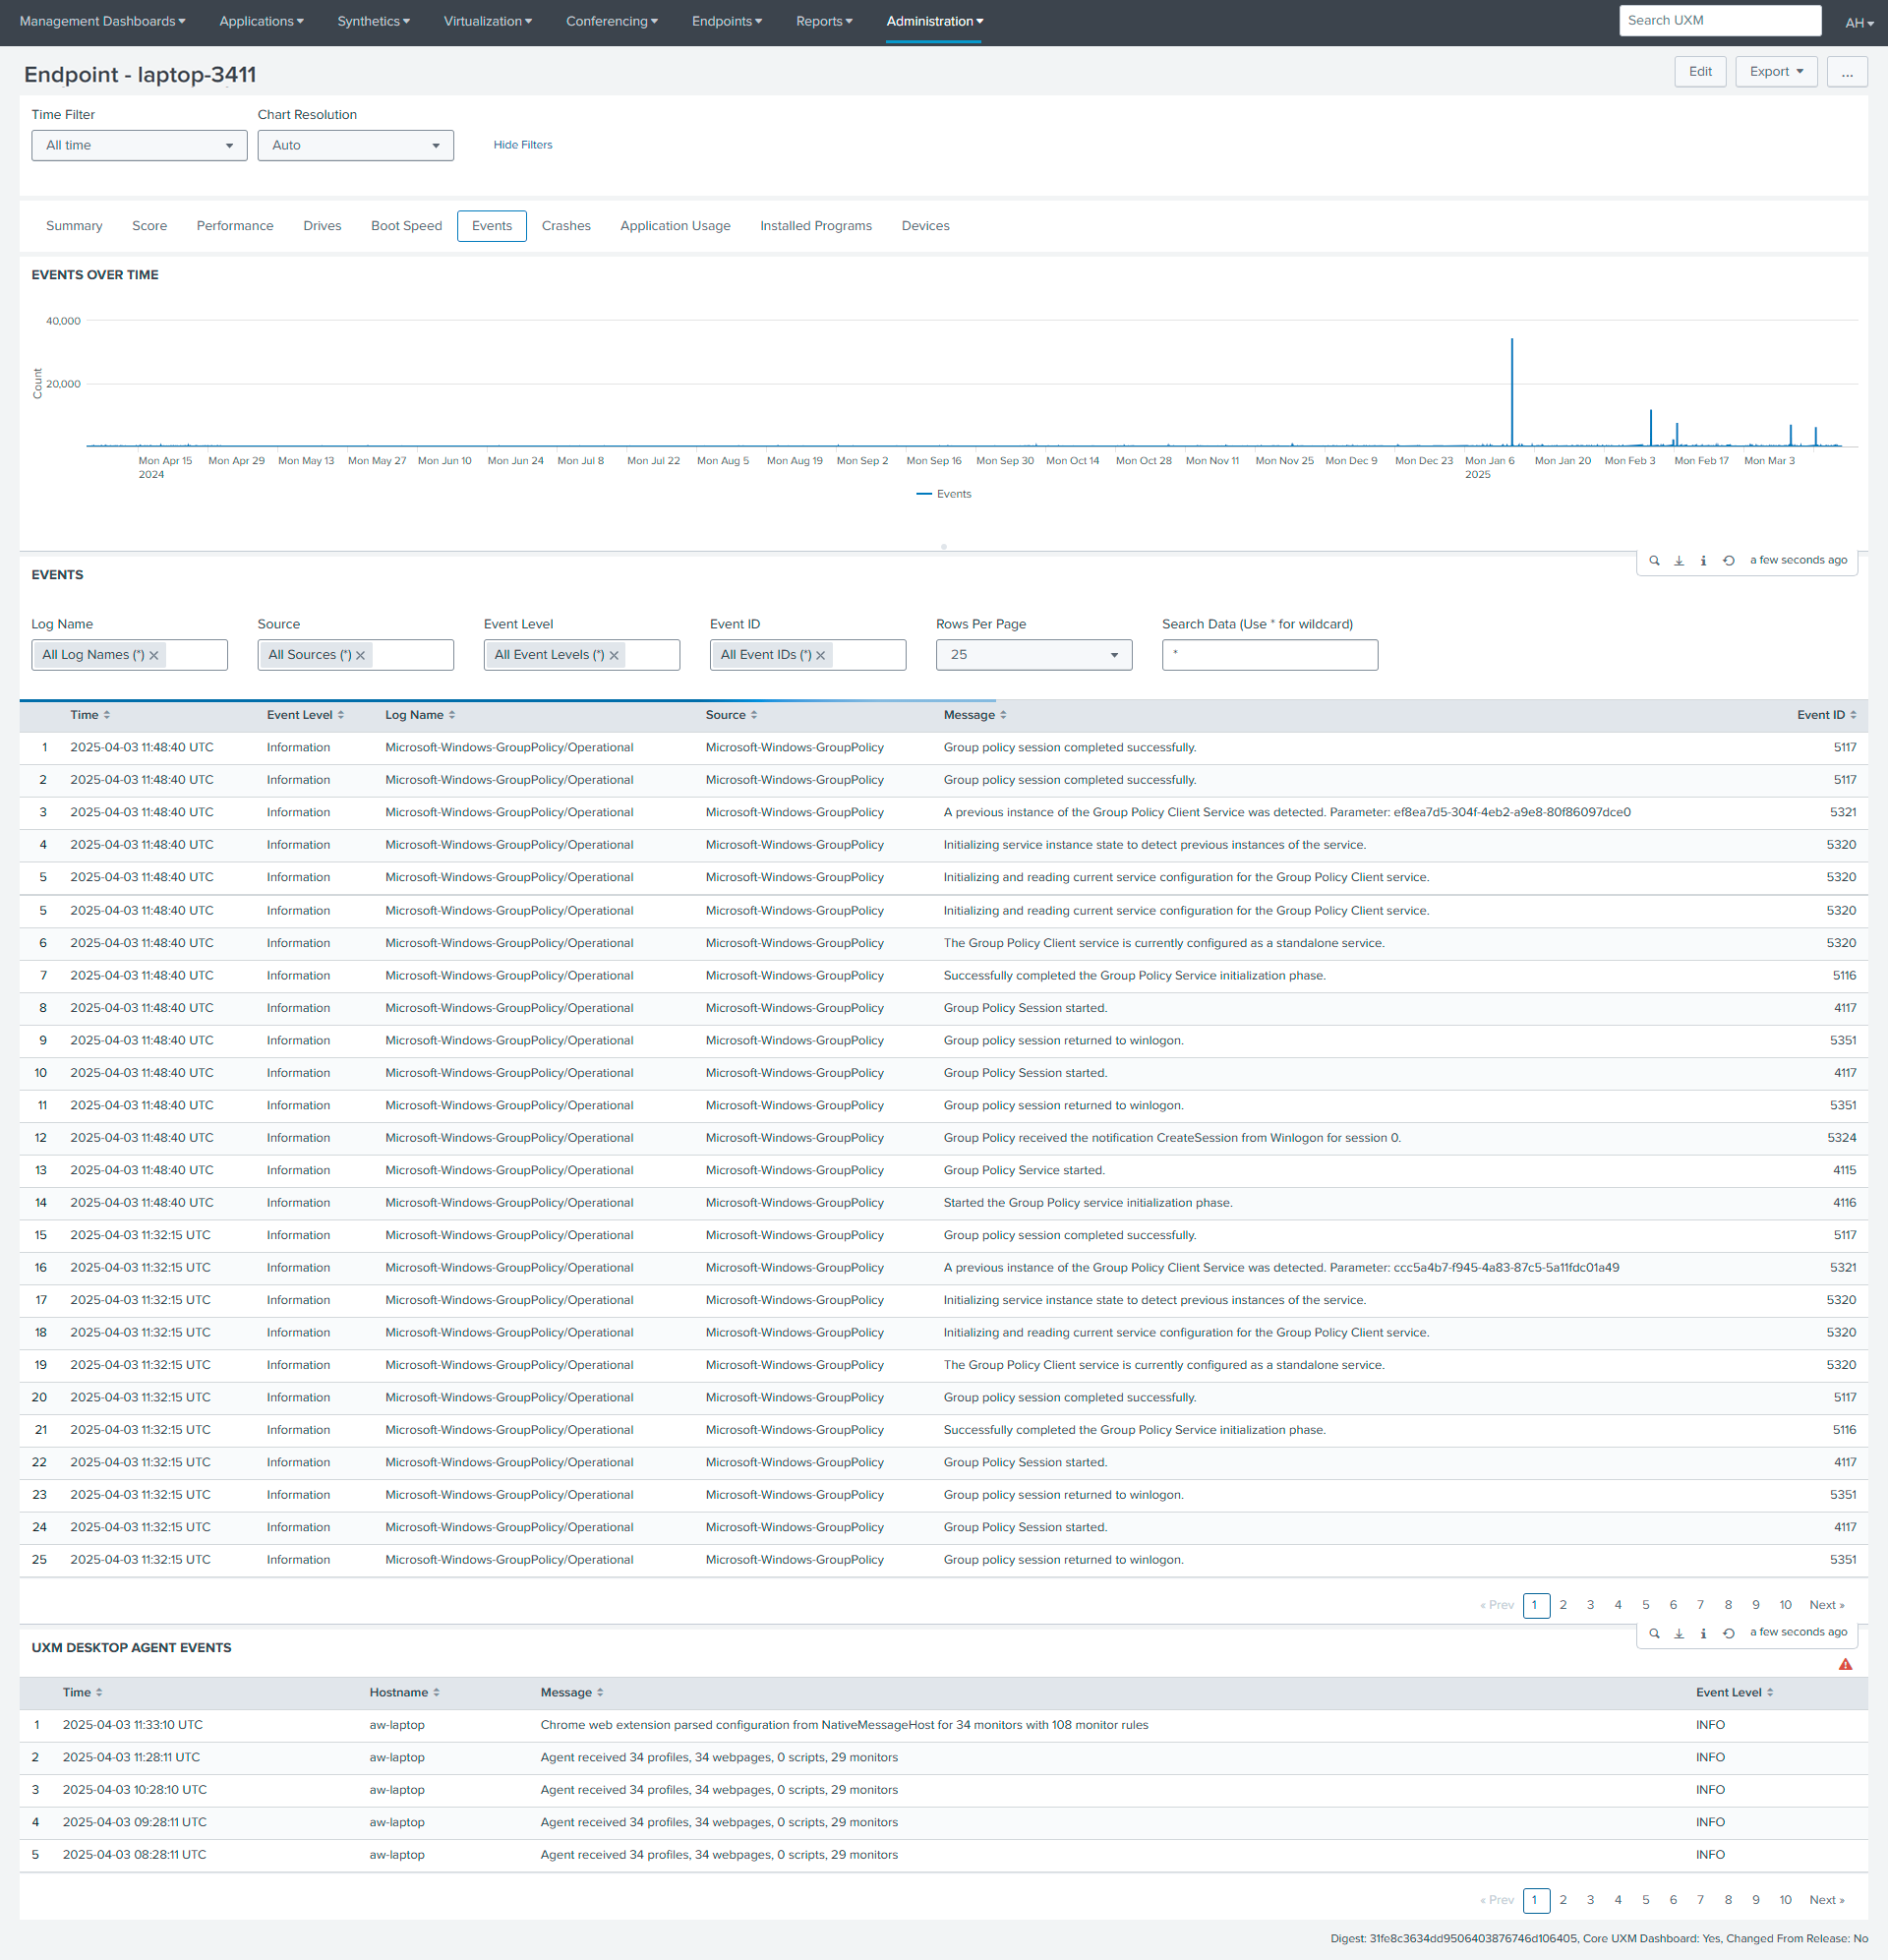
Events Over Time
The Events Over Time chart provides a visual representation of event frequency over a selected time range, allowing for the quick identification of event spikes and patterns. This chart is crucial for understanding the overall event activity and identifying potential anomalies or recurring issues that might require further investigation.
Events Table
The Events table offers a detailed log of individual events, capturing essential information such as timestamps,event ID, sources, event levels, and messages. This comprehensive log facilitates effective troubleshooting, security monitoring, and performance analysis by providing granular insights into system behavior and potential problems.
UXM Desktop Agent Events
This table specifically logs events related to the UXM Desktop Agent, providing insights into user-specific activities and agent functionality. This table assists in diagnosing issues related to the user's desktop environment and helps in understanding the behavior of the UXM Desktop Agent for troubleshooting purposes.
Crashes
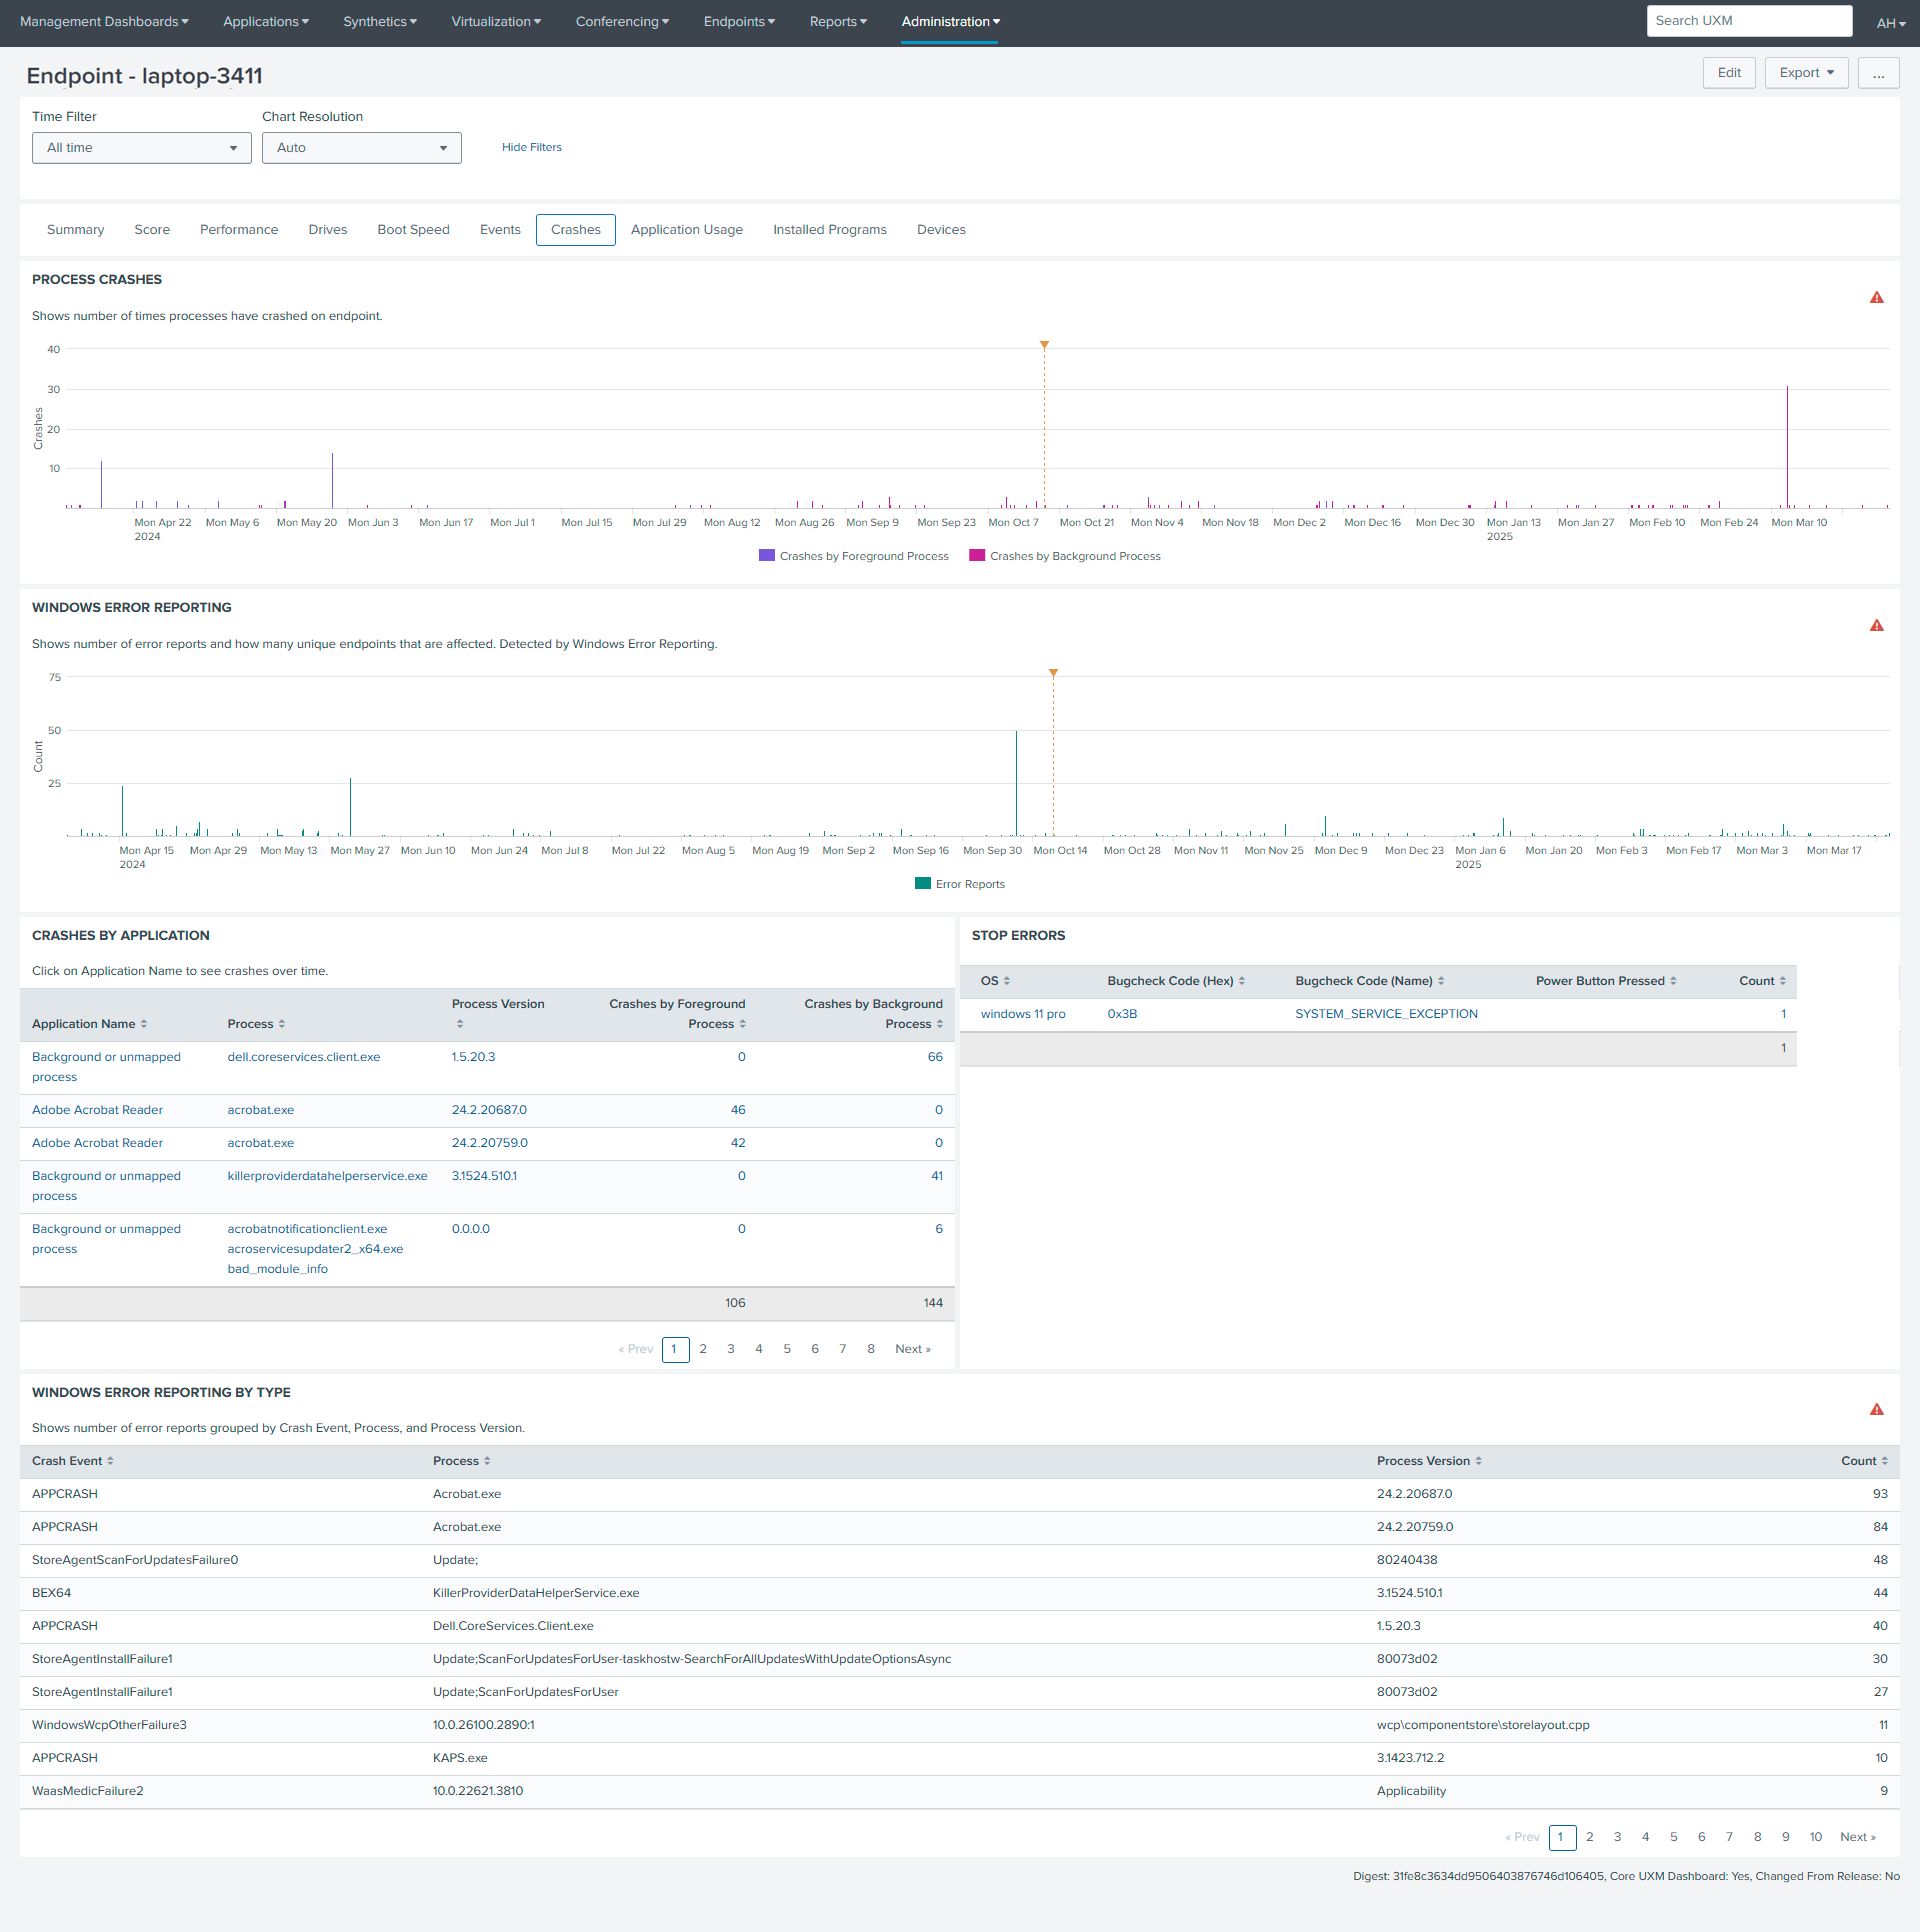
Process Crashes
It presents a temporal view of process instability on the endpoint, displaying the number of process crashes over time. It distinguishes between crashes of foreground processes and background processes . This allows for a more nuanced understanding of system stability, highlighting periods of high crash frequency and indicating whether user-facing applications or background services are primarily affected. This information is crucial for pinpointing potential software or system issues and guiding troubleshooting efforts.
Windows Error Reporting
This chart displays the number of unique error reports over time, providing insights into the variety and occurrence of different system errors. This chart helps identify trends and potential patterns in error reporting, aiding in proactive issue resolution.
Crashes By Application
This table provides a detailed breakdown of crashes by application, including version, crash counts, and error codes. This table allows for targeted troubleshooting of application-related issues and helps prioritize efforts based on the frequency of crashes.
Stop Errors
It presents crucial information such as the operating system, the hexadecimal and human-readable bugcheck codes, whether the power button was pressed during the error, and the number of times the error occurred. This table serves as a valuable resource for troubleshooting and identifying specific error types, analyzing error frequency, and investigating potential hardware or power-related issues.
Windows Error Reporting By Type
This table categorizes Windows errors by type and process, providing crash counts. This table helps identify common system-level errors and aids in the troubleshooting of recurring issues based on error type and associated processes.
Application Usage
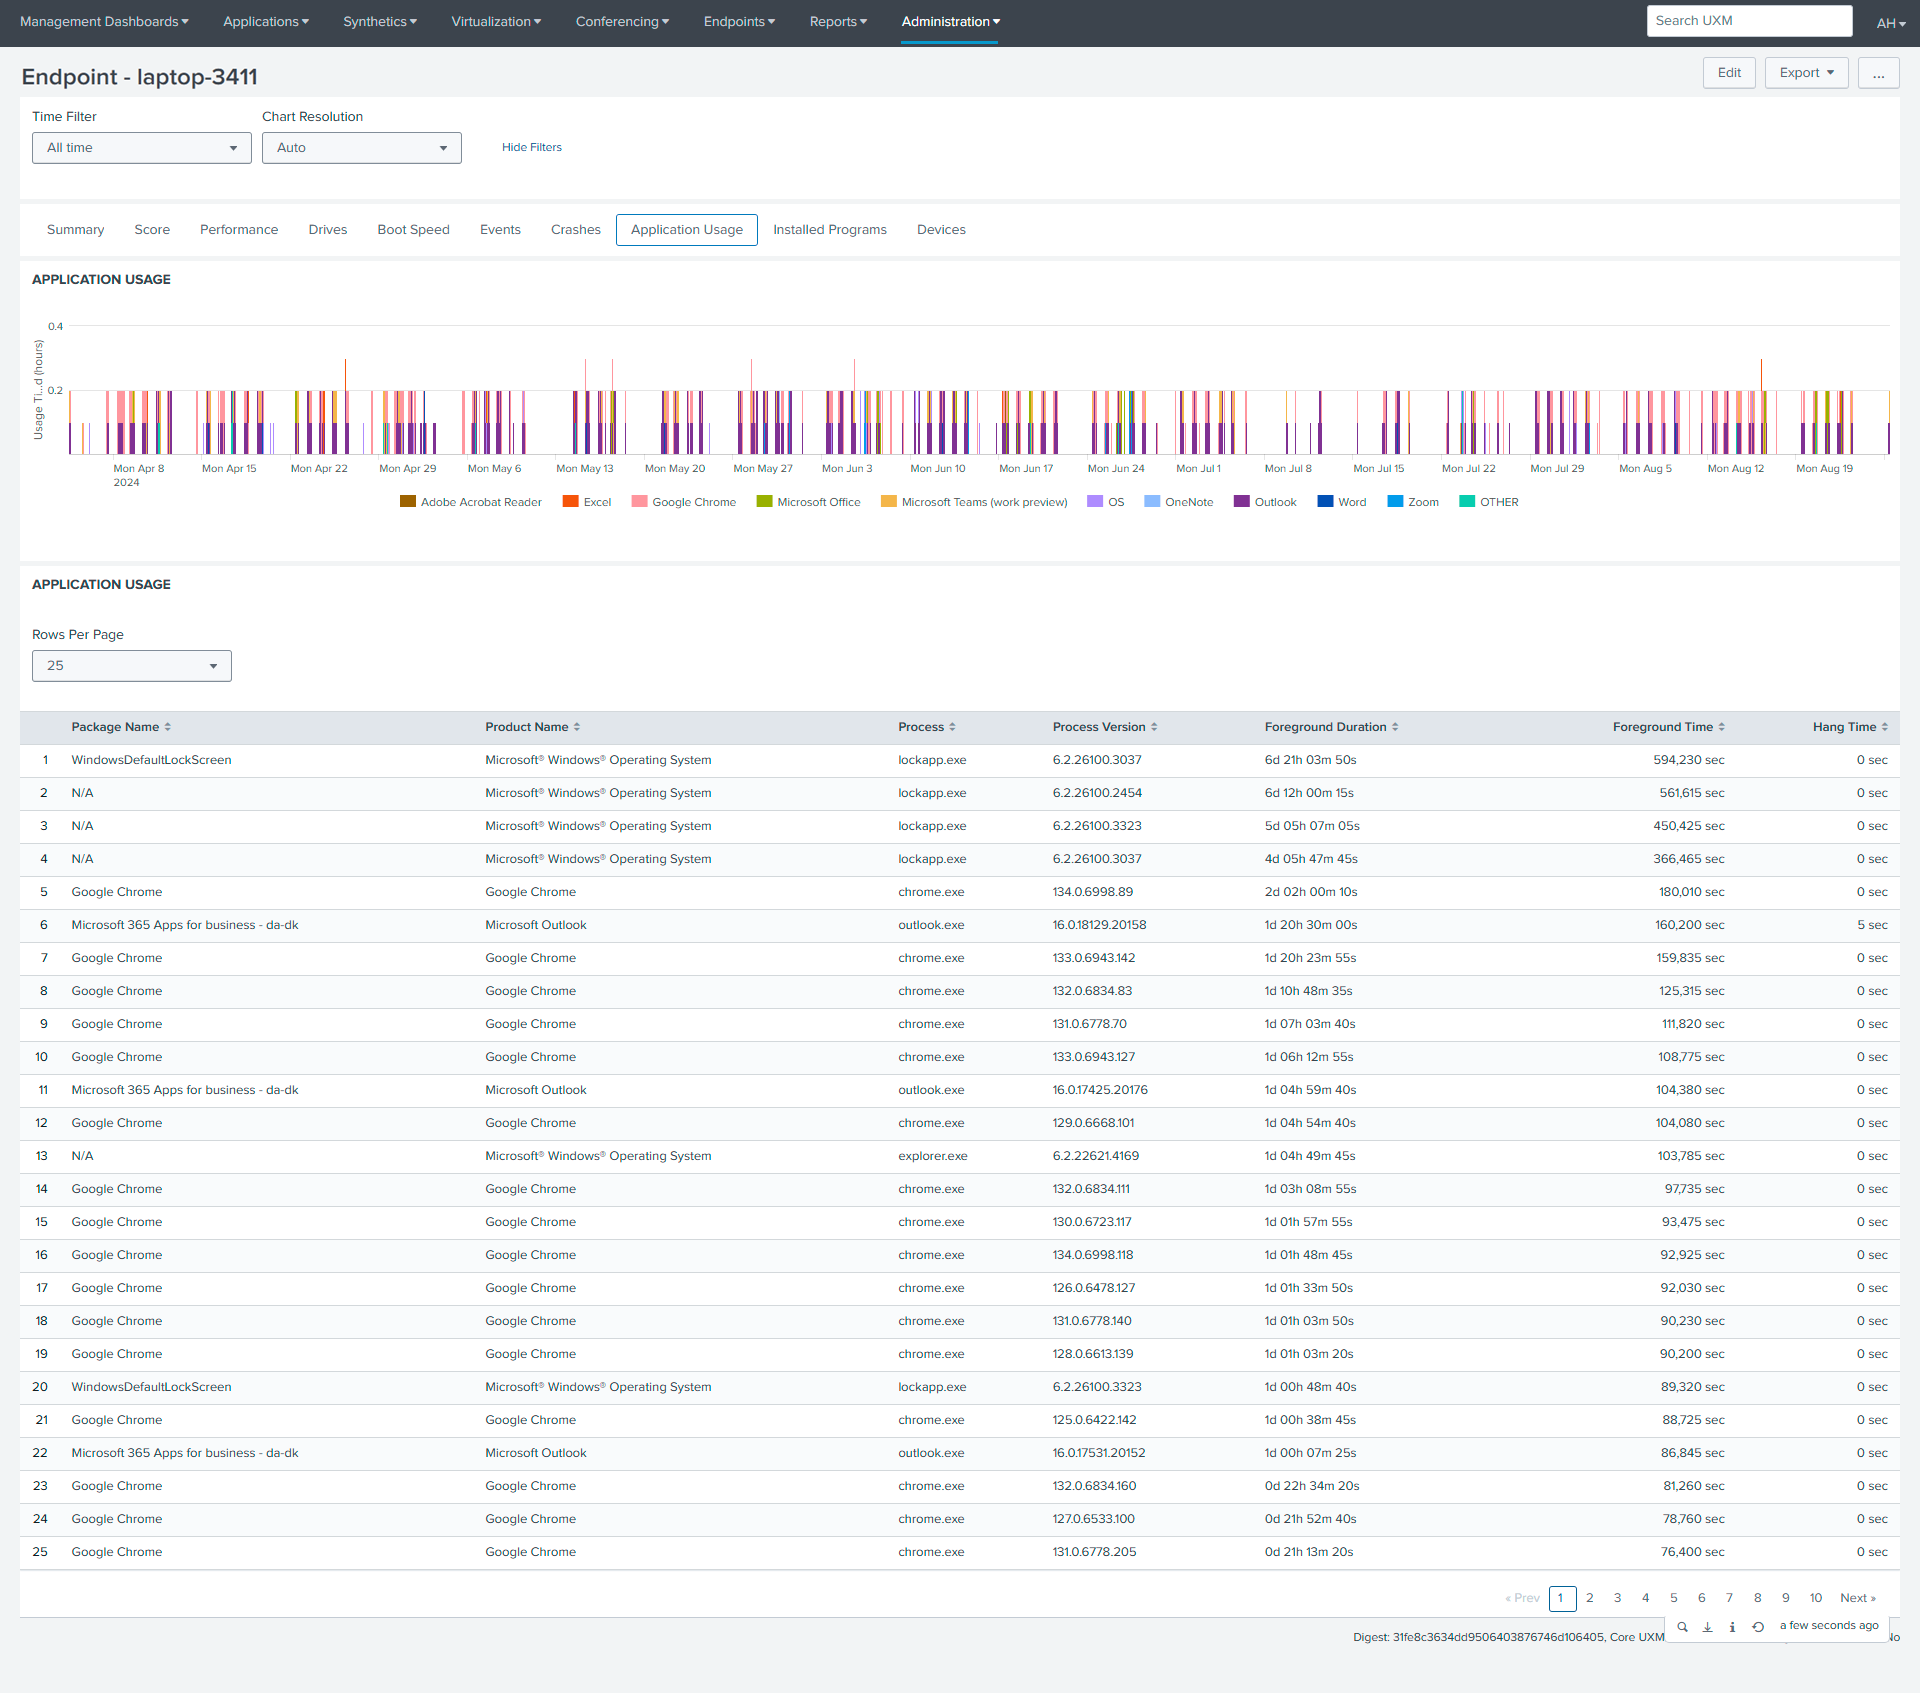
Application Usage
This chart provides a temporal overview of application usage, visualizing the frequency and duration of application activity over a selected time range. Color-coded indicators highlight the usage patterns of specific applications, enabling the identification of peak usage periods and frequently used applications.
Application Usage
The Application Usage table offers a detailed breakdown of application usage data, including package name, product name, process, version, foreground time, and total time. This table allows for in-depth analysis of application activity, providing insights into resource consumption, usage duration, and background activity, facilitating troubleshooting and optimization efforts.
Installed Programs
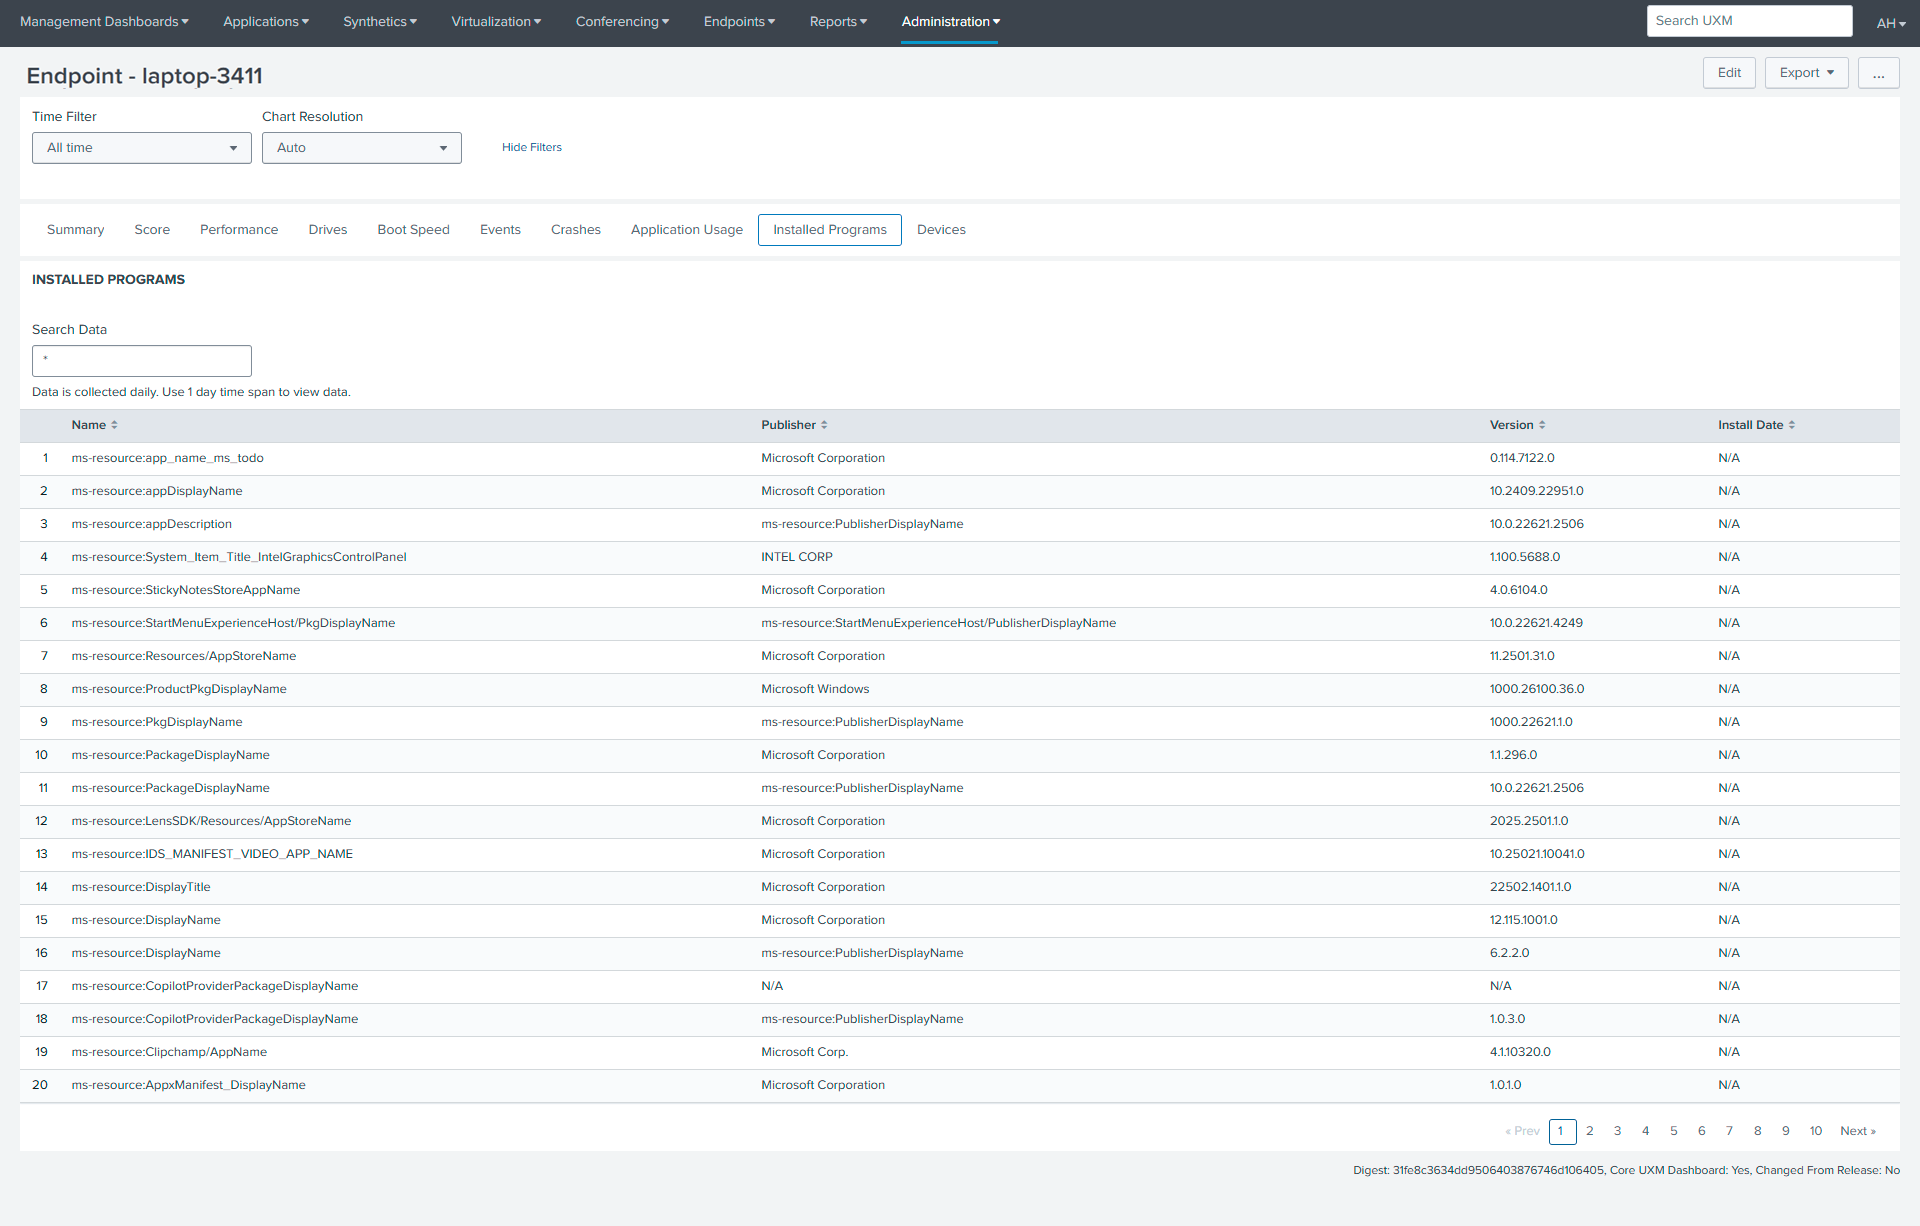
Installed Programs
The Installed Programs table presents a comprehensive list of software installed on the endpoint. This table includes key information such as the program's name, publisher, version, and installation date. It serves as a valuable tool for software inventory management, troubleshooting, security auditing, and license tracking, enabling administrators to effectively manage the software environment on the endpoint.
Devices
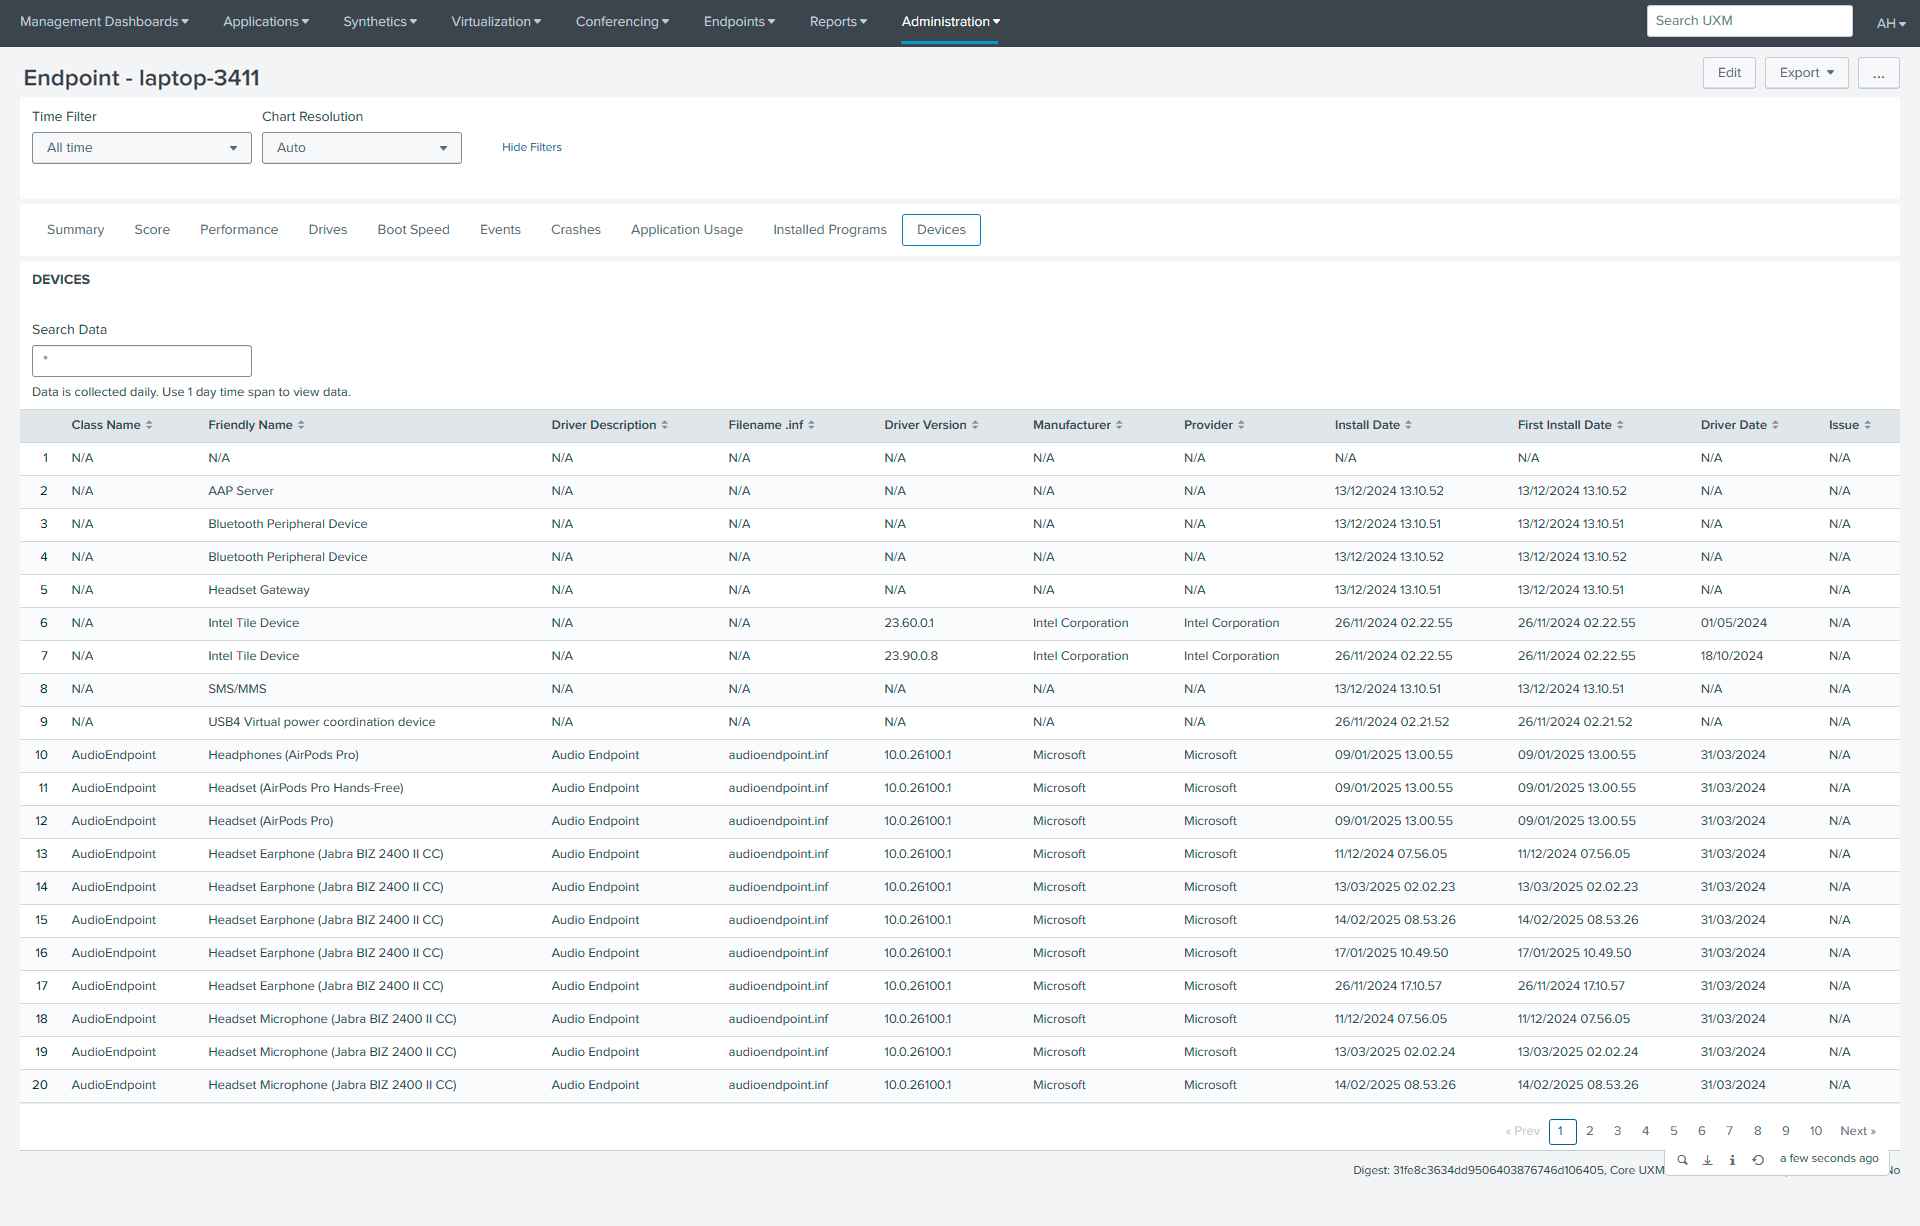
The Devices table presents a comprehensive inventory of hardware components and peripherals connected to or installed on the endpoint. This table includes essential information such as device class, friendly name, driver details, manufacturer, and installation dates. It serves as a valuable tool for hardware inventory management, driver management, troubleshooting, compatibility checks, and security auditing, enabling administrators to effectively manage the hardware environment on the endpoint.