Browser Errors
It provides an overview of the Browser Error Monitoring Dashboard, which is designed to help system administrators to track and analyze website and client browser errors.
Browser Error By
The chart represents a time-series view of browser error distribution across different devices. Grouped by endpoint hostname, it displays the daily error count through stacked bars, where each color-coded segment represents a specific device's contribution.
The chart facilitates the identification of error trends, problematic endpoints, and sudden spikes, enabling users to quickly pinpoint and address browser-related issues across their system. Group by option can be used to change the data displayed in the bar graph.
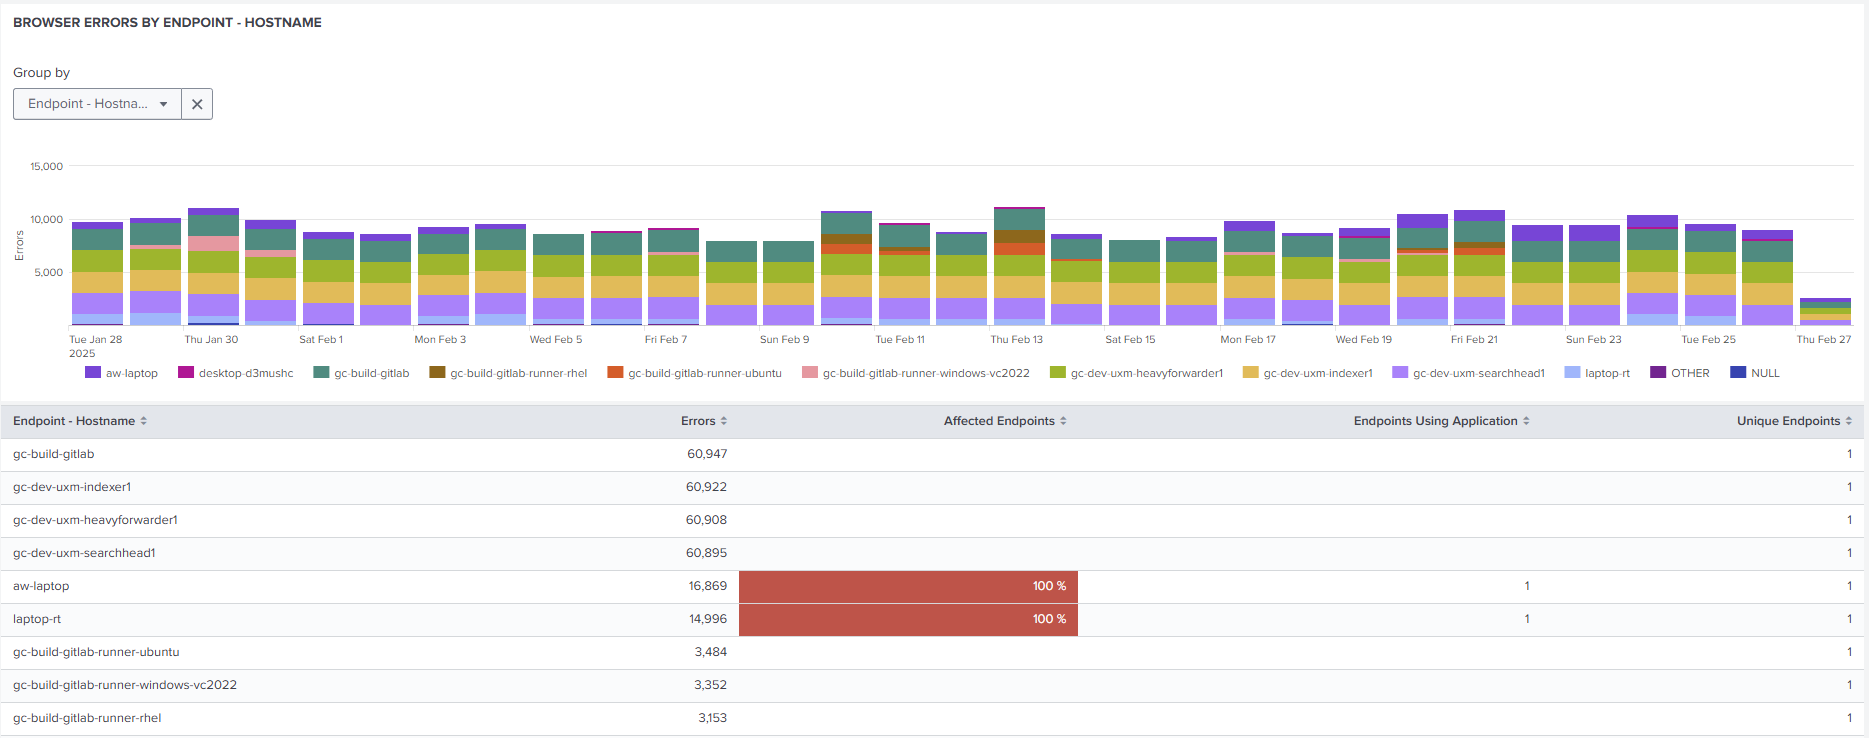
The table displays a list of endpoints (devices) sorted by the number of error they've generated. Each row shows the endpoint's hostname, the count of errors, the number of affected, the number of endpoints using the application, and the number of unique.
Browser Errors Details
This table provides a granular view of browser-related errors, categorized by "Browser Error Category," "Browser Error Code," and "Browser URL." Each row represents a specific error instance, detailing the application name, user username, and the number of errors associated with that instance. This allows for detailed troubleshooting and analysis of browser issues, pinpointing specific error types, URLs, and affected users. Additional columns can be added from 'Group by' selection.
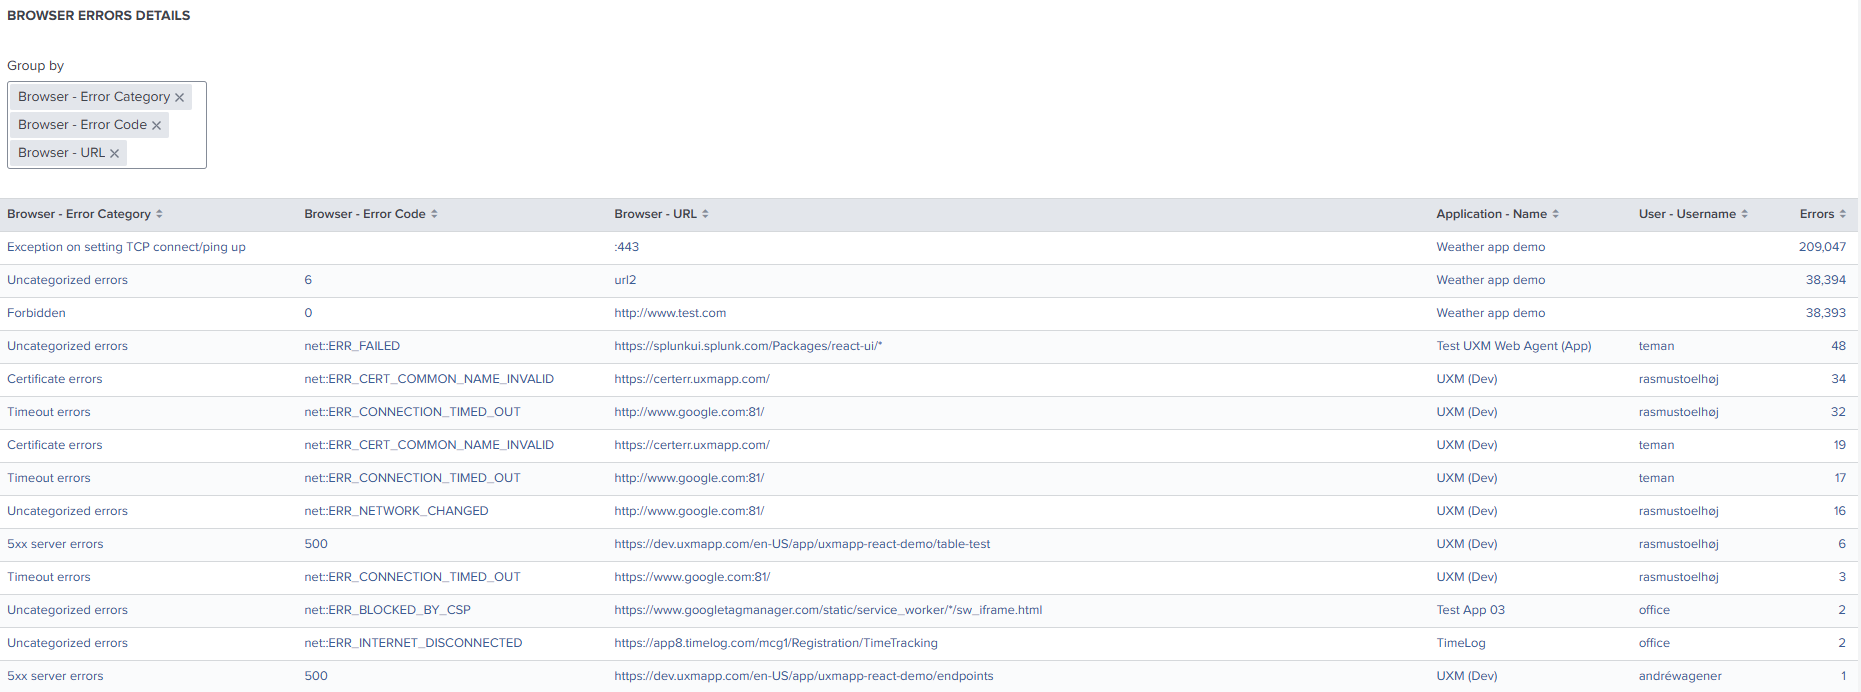
By clicking on any row it will redirect to the Web Application Requests page.