SLA
Overview
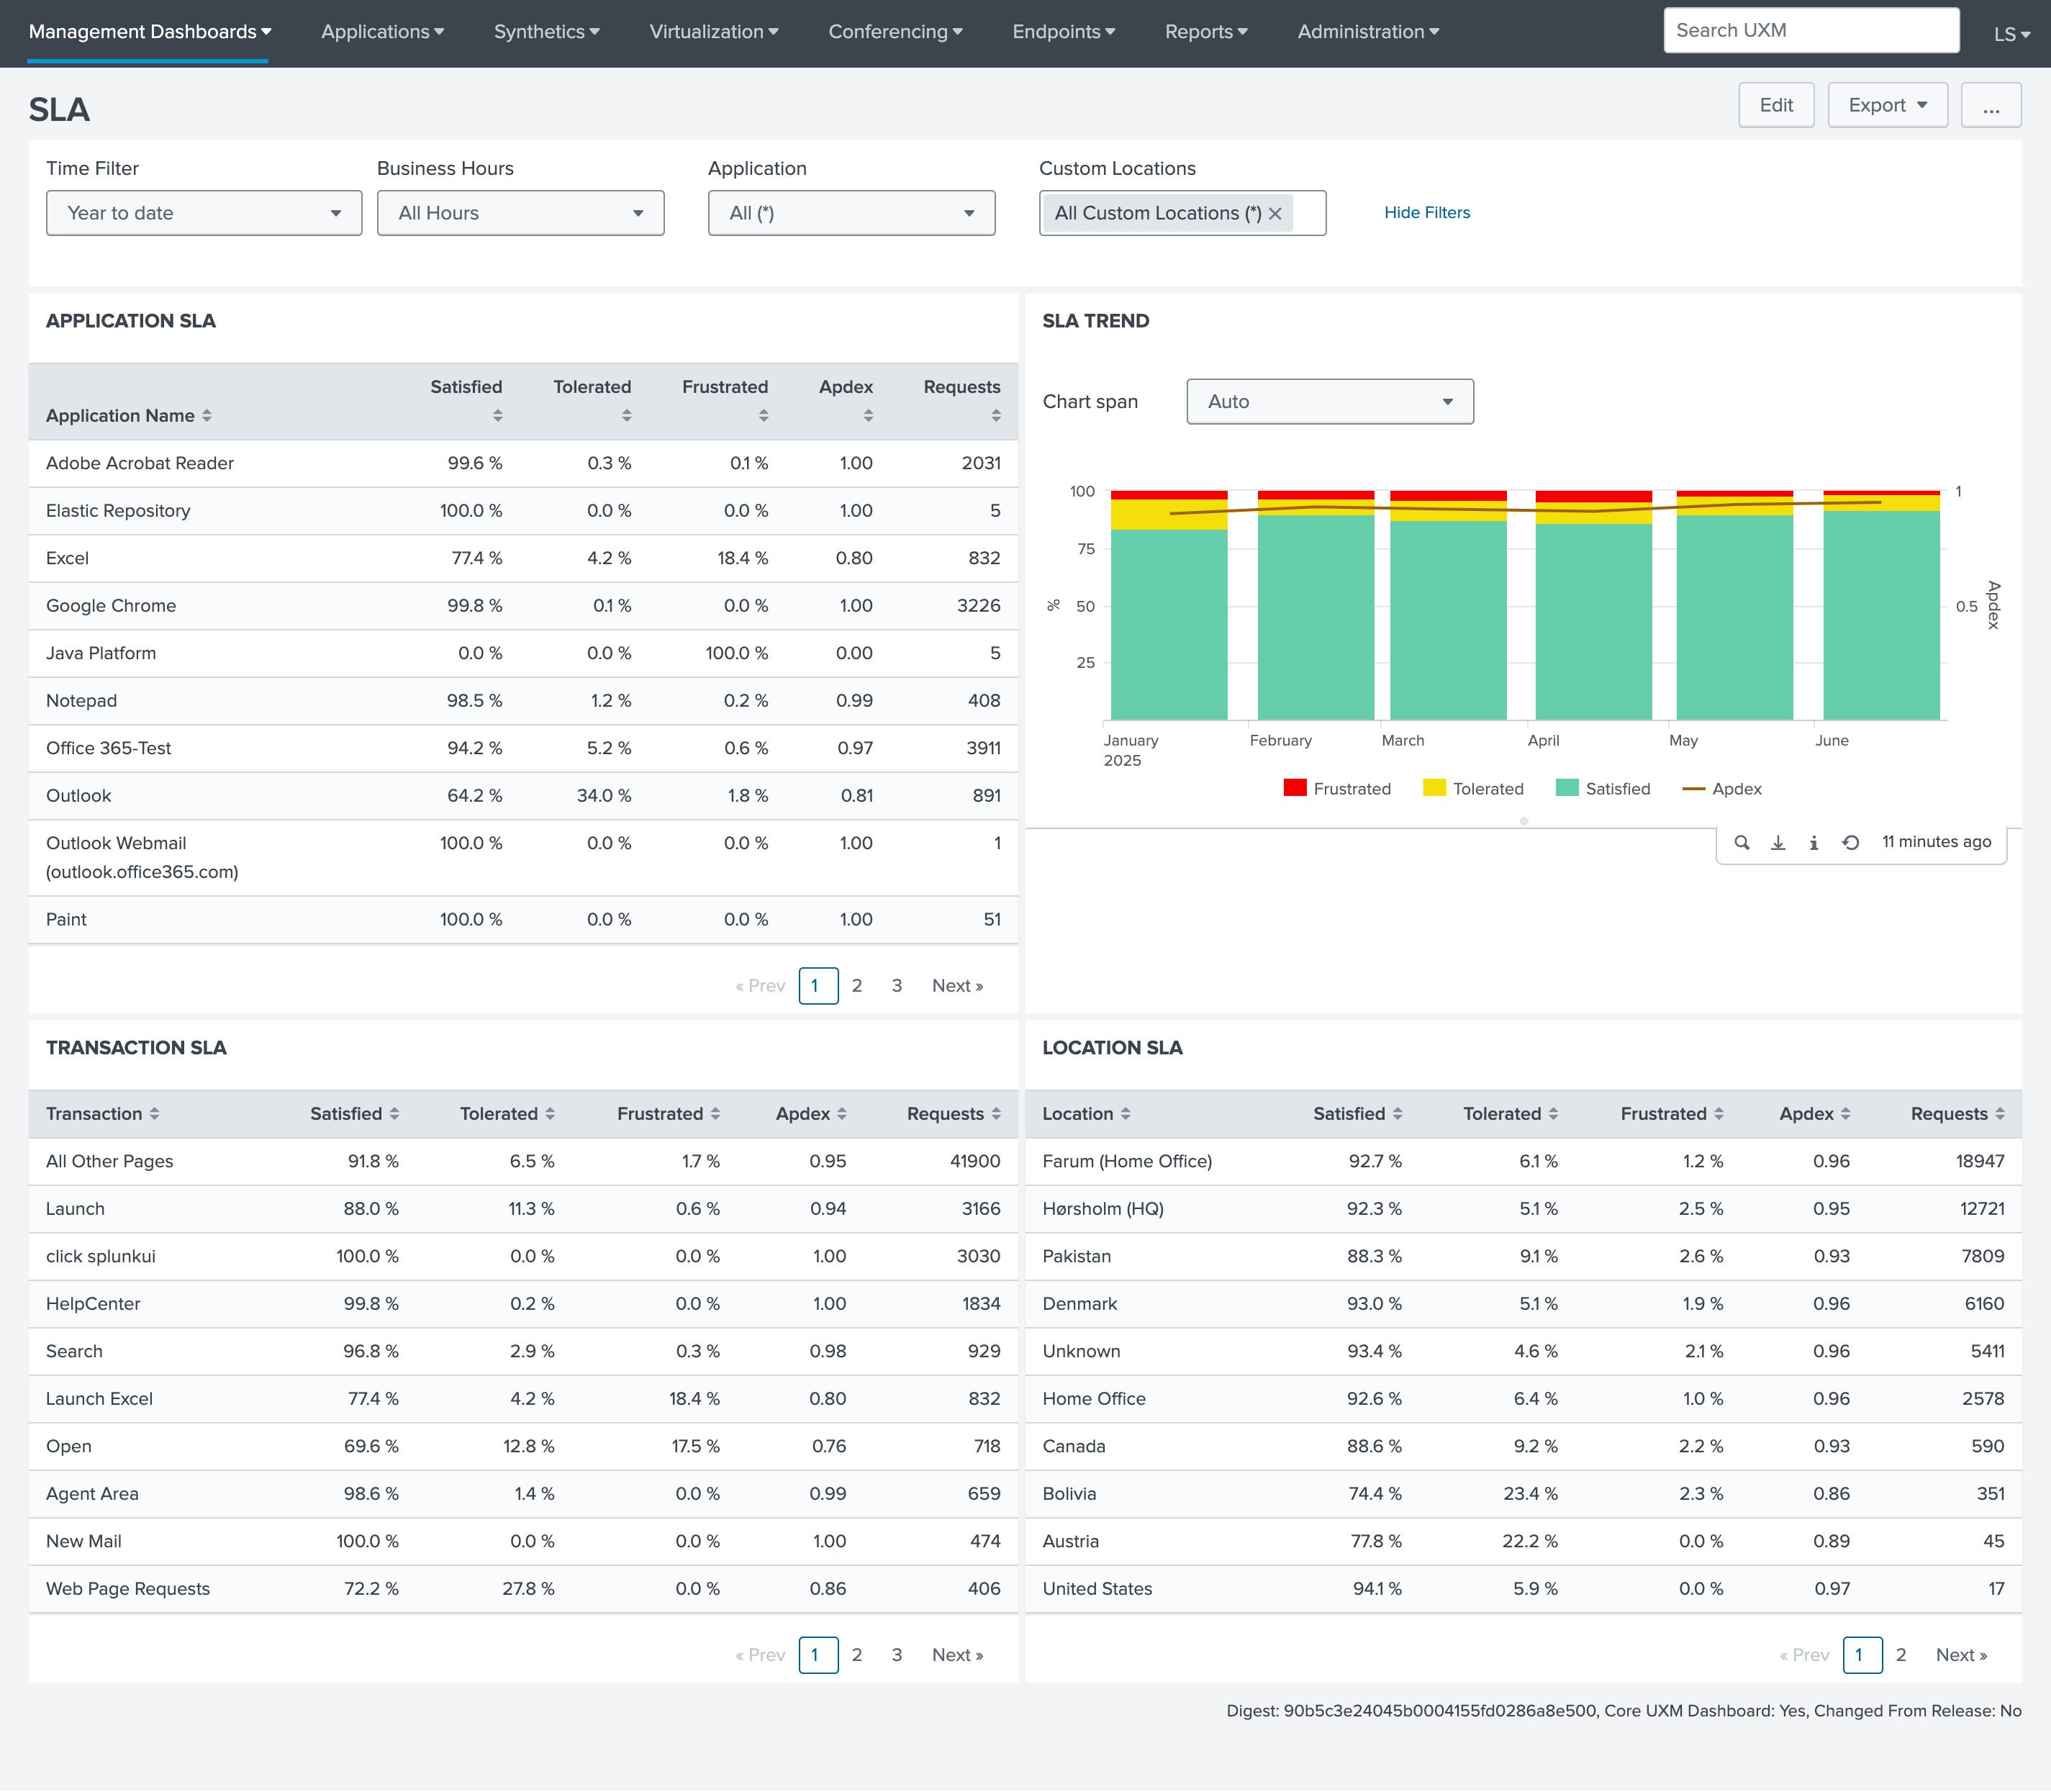
The SLA dashboard provides information about the monitored applications performance.
Metrics
- Application Name / Transaction / Location: Data is split by Application Name, Transaction performed by the application, and the Location where the event occurred.
- Satisfied: Percentage of requests that are within the satisfied SLA definition. (Under X seconds)
- Tolerated: Percentage of requests that are within the tolerated SLA definition. (Above X and below Y seconds)
- Frustrated: Percentage of requests that are within the frustrated SLA definition. (Above Y seconds)
- Apdex: The Apdex score is based on the ratio of satisfied and tolerating requests by the total requests made.
![]()
- Requests: Amount of requests made by a client, via web application, to a server in order to retrieve information or other resource. In the case of a desktop application, it refers to the number of requests made by a user when interacting with the application user interface (UI).
SLA Definitions
To see how the SLA's are defined go to: Administration - SLAs
At the SLA's page you can:
- Define Satisfied, Tolerated, and Frustrated SLA times.
- Bulk edit / mass update the different SLA's.