Application Usage
Dashboard to analyze application usage, the UXM desktop agent monitors application in foreground every 3 seconds, summaries it and sends it to UXM at the configured interval in the Process Monitor (Default each 5 minute)
This dashboard can be used to:
- See most used applications in the organization.
- See hourly/daily peak concurrent usage for license management.
- Click on Analyze application usage to see unique endpoint devices using application for license management based on seat/hostname based licenses.
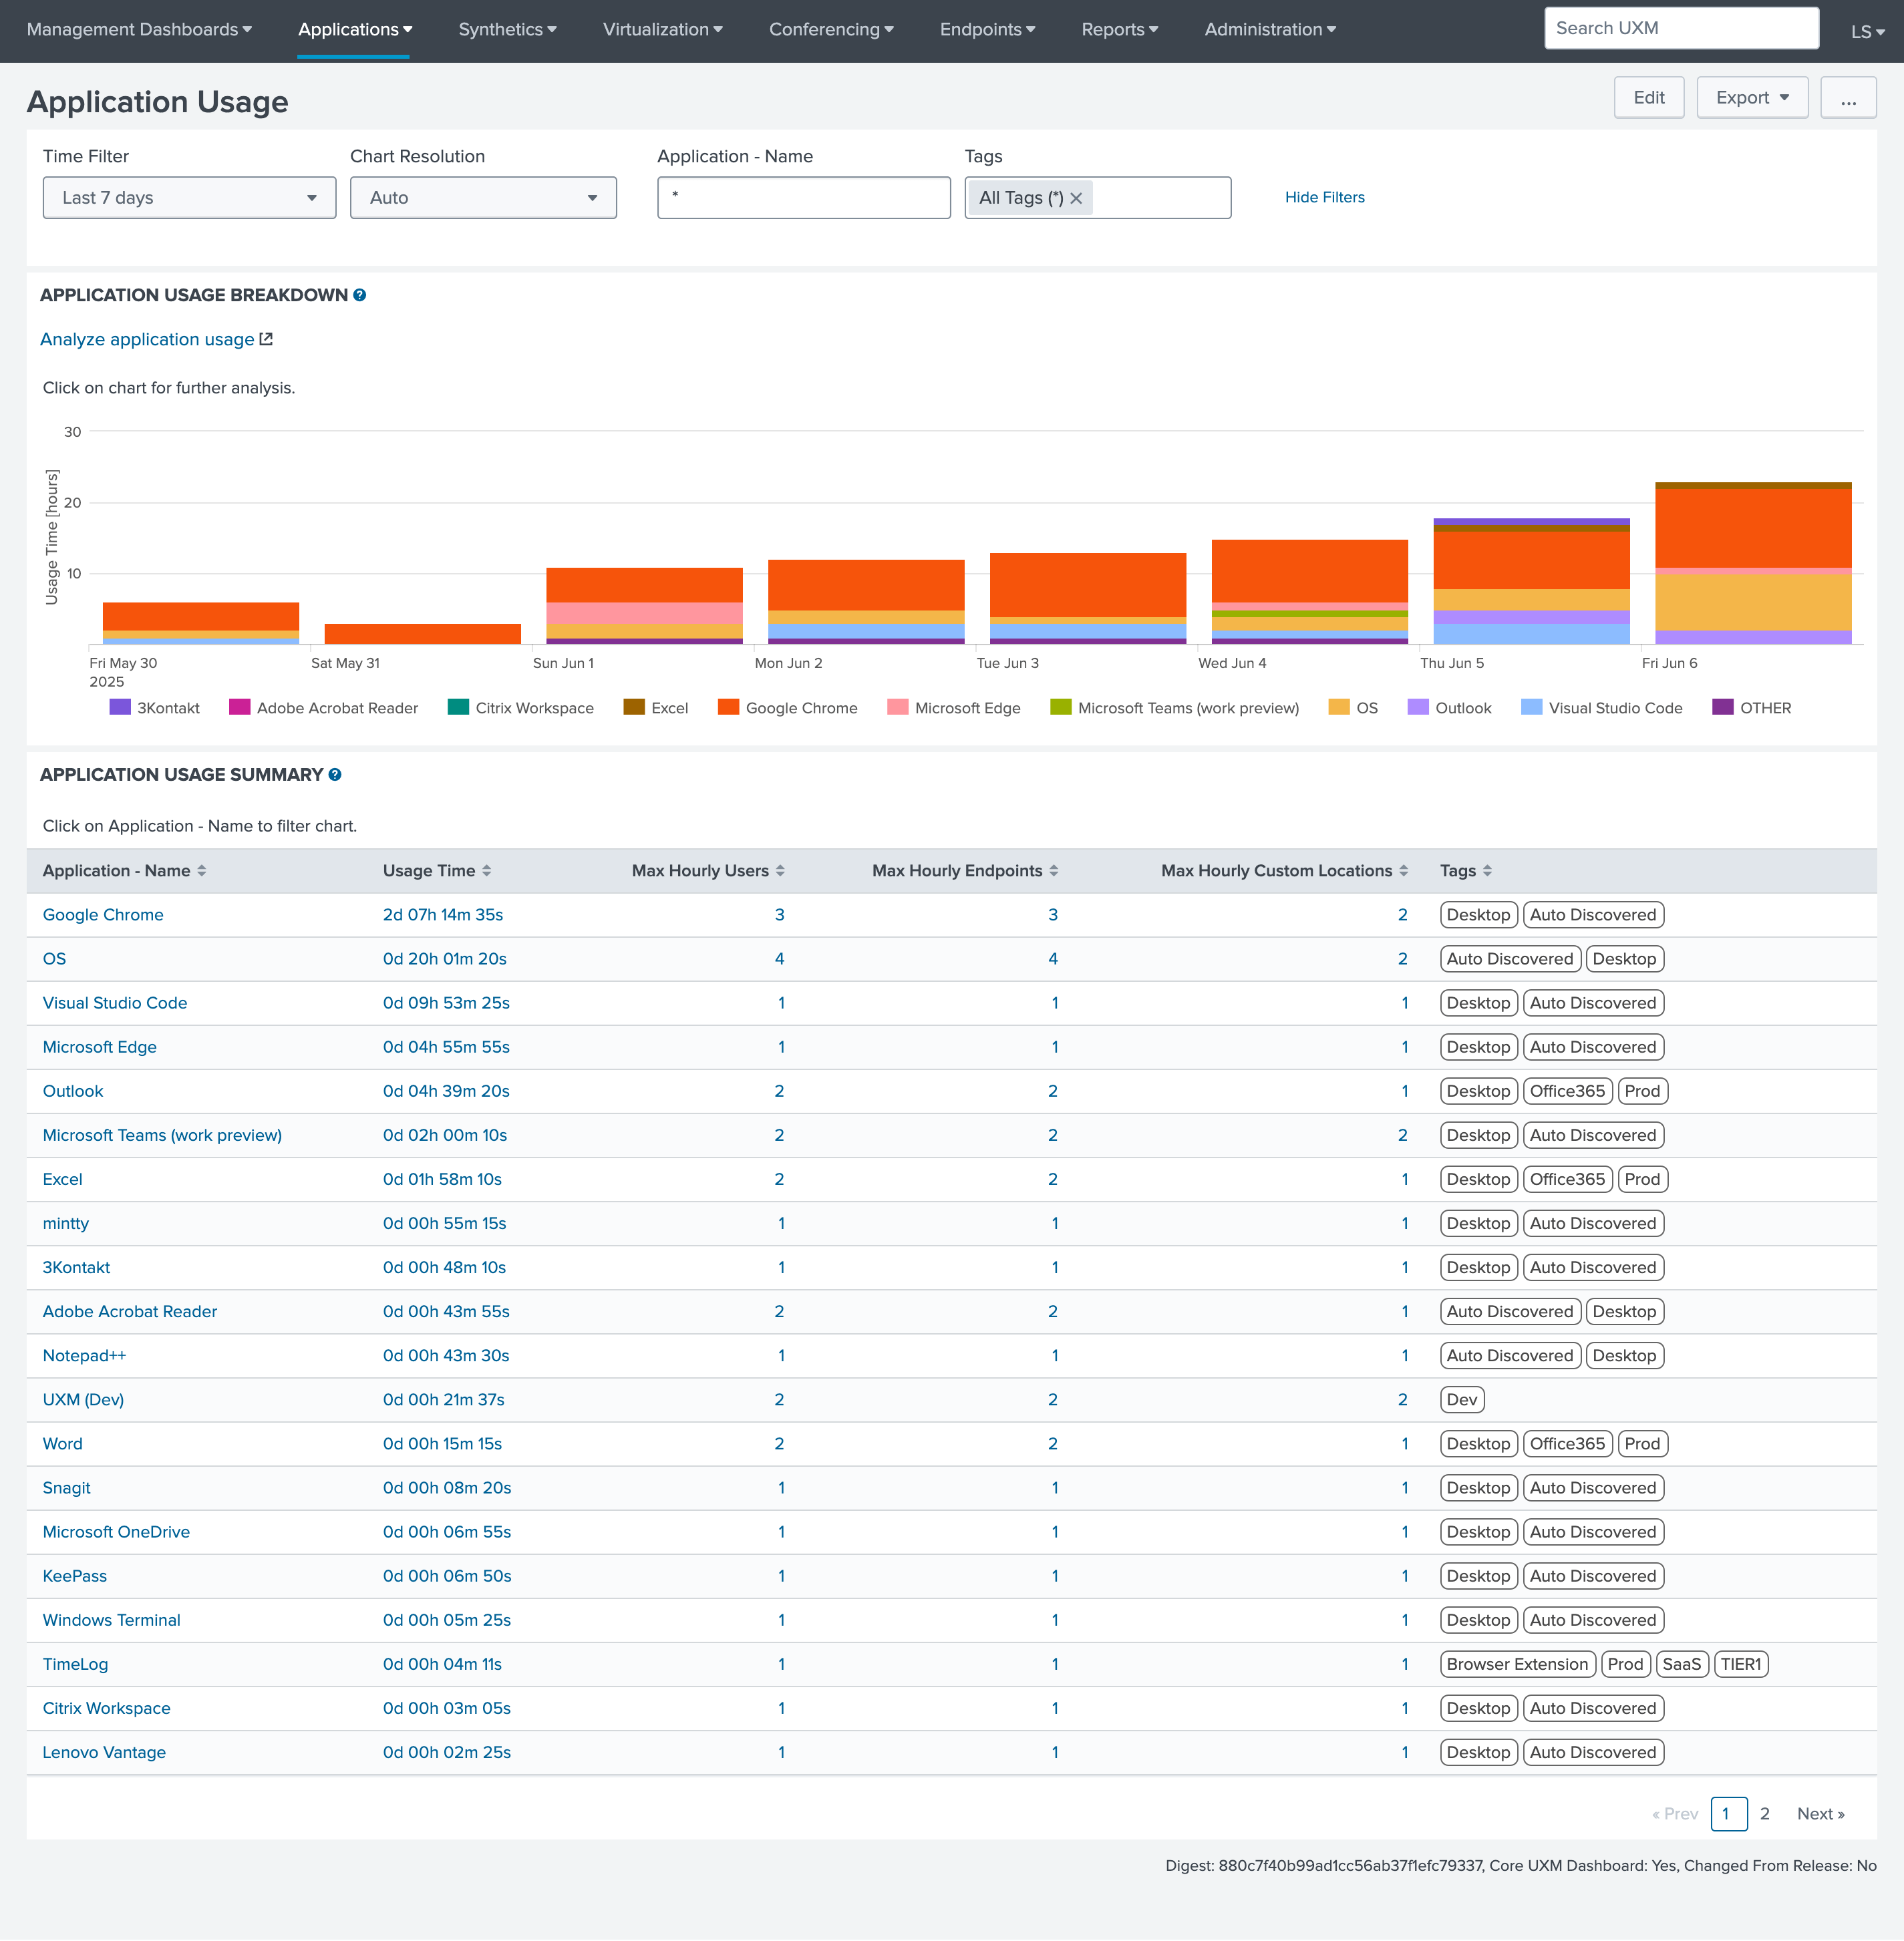
Metrics
It provides an overview of application usage within the organization.
- Application Name: Lists the software being monitored, with each entry marked as an identifier.
- Usage Time: Total duration each application has been in use (foreground), formatted in days, hours, minutes, and seconds.
- Max Hourly Users: Maximum number of concurrent users using the application.
- Max Hourly Endpoints: Maximum number of concurrent endpoints using the application.
- Max Hourly Custom Locations: Maximum number of concurrent locations from where the application is being used.
- Tags: Contains metadata, such as the platform (e.g., Desktop, Web Agent) and discovery method (e.g., Auto Discovered).
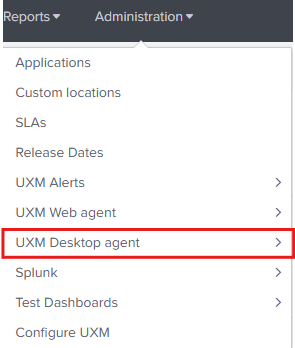
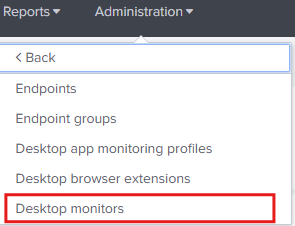
Requirements
A Process Monitor needs to be configured with "Foreground app usage" checked.
-
UXM Desktop monitors (under Administration -> UXM Desktop Agent -> Desktop monitors)
Please be aware that increasing the interval in which the summarized data is send could lead to data loss due to samples not being send if users shutdown the laptop or logs out of a virtual desktop session, it's recommended to keep under 15 minute interval .
- UXM Desktop agents needs to be installed on the following endpoint devices:
- Endpoint devices: The UXM Desktop agent needs to be installed on the local endpoint devices.
- Citrix: The UXM Desktop agent needs to be install on the Citrix Delivery Controller (DC) and Virtual Delivery Agent (VDA) servers.
- Servers/Azure Virtual Desktops (AVD)/RDS: The UXM Desktop agent needs to be install on the Windows servers.
- Daily executed data input script "daily_maintenance.py" updates ux_applications_lookup with discovered applications and maps the process executables to the application name, the application usage will be calculated for the application after it's discovered.
- Scheduled report
summary\_metrics\_application\_foreground\_time\_hourly\_rollupneeds to be enabled and runs hourly and summarized the data received by the process monitor.
The index can be backfilled by running the following command on the Search Head server:
cd /opt/splunk/bin
./splunk cmd python fill\_summary\_index.py -name "summary\_metrics\_application\_foreground\_time\_hourly\_rollup" -et -1mon@mon -lt -2h@h
Data Collected
Desktop Applications
The UXM Desktop Agent monitors the application in foreground every 3 seconds, summaries the data and sends it to UXM at the configured interval in the Process Monitor. (Default each 5 minute)
The process .exe information is extracted containing Publisher, Name, Version (File and Product), Path and Company.
The usage is linked to installed applications when possible.
Detected applications can be renamed, so the processname.exe matches what the customer calls the application internally.
Web Applications
UXM Web Agent uses the response time as Application Usage.
Browser Extension
UXM Browser Extension uses the response time as Application Usage, in next release it can be setup to summarize time tab is in foreground on configured urls.
Application Usage Analysis
Displayed when clicking Analyze application usage it shows top most used applications over time.
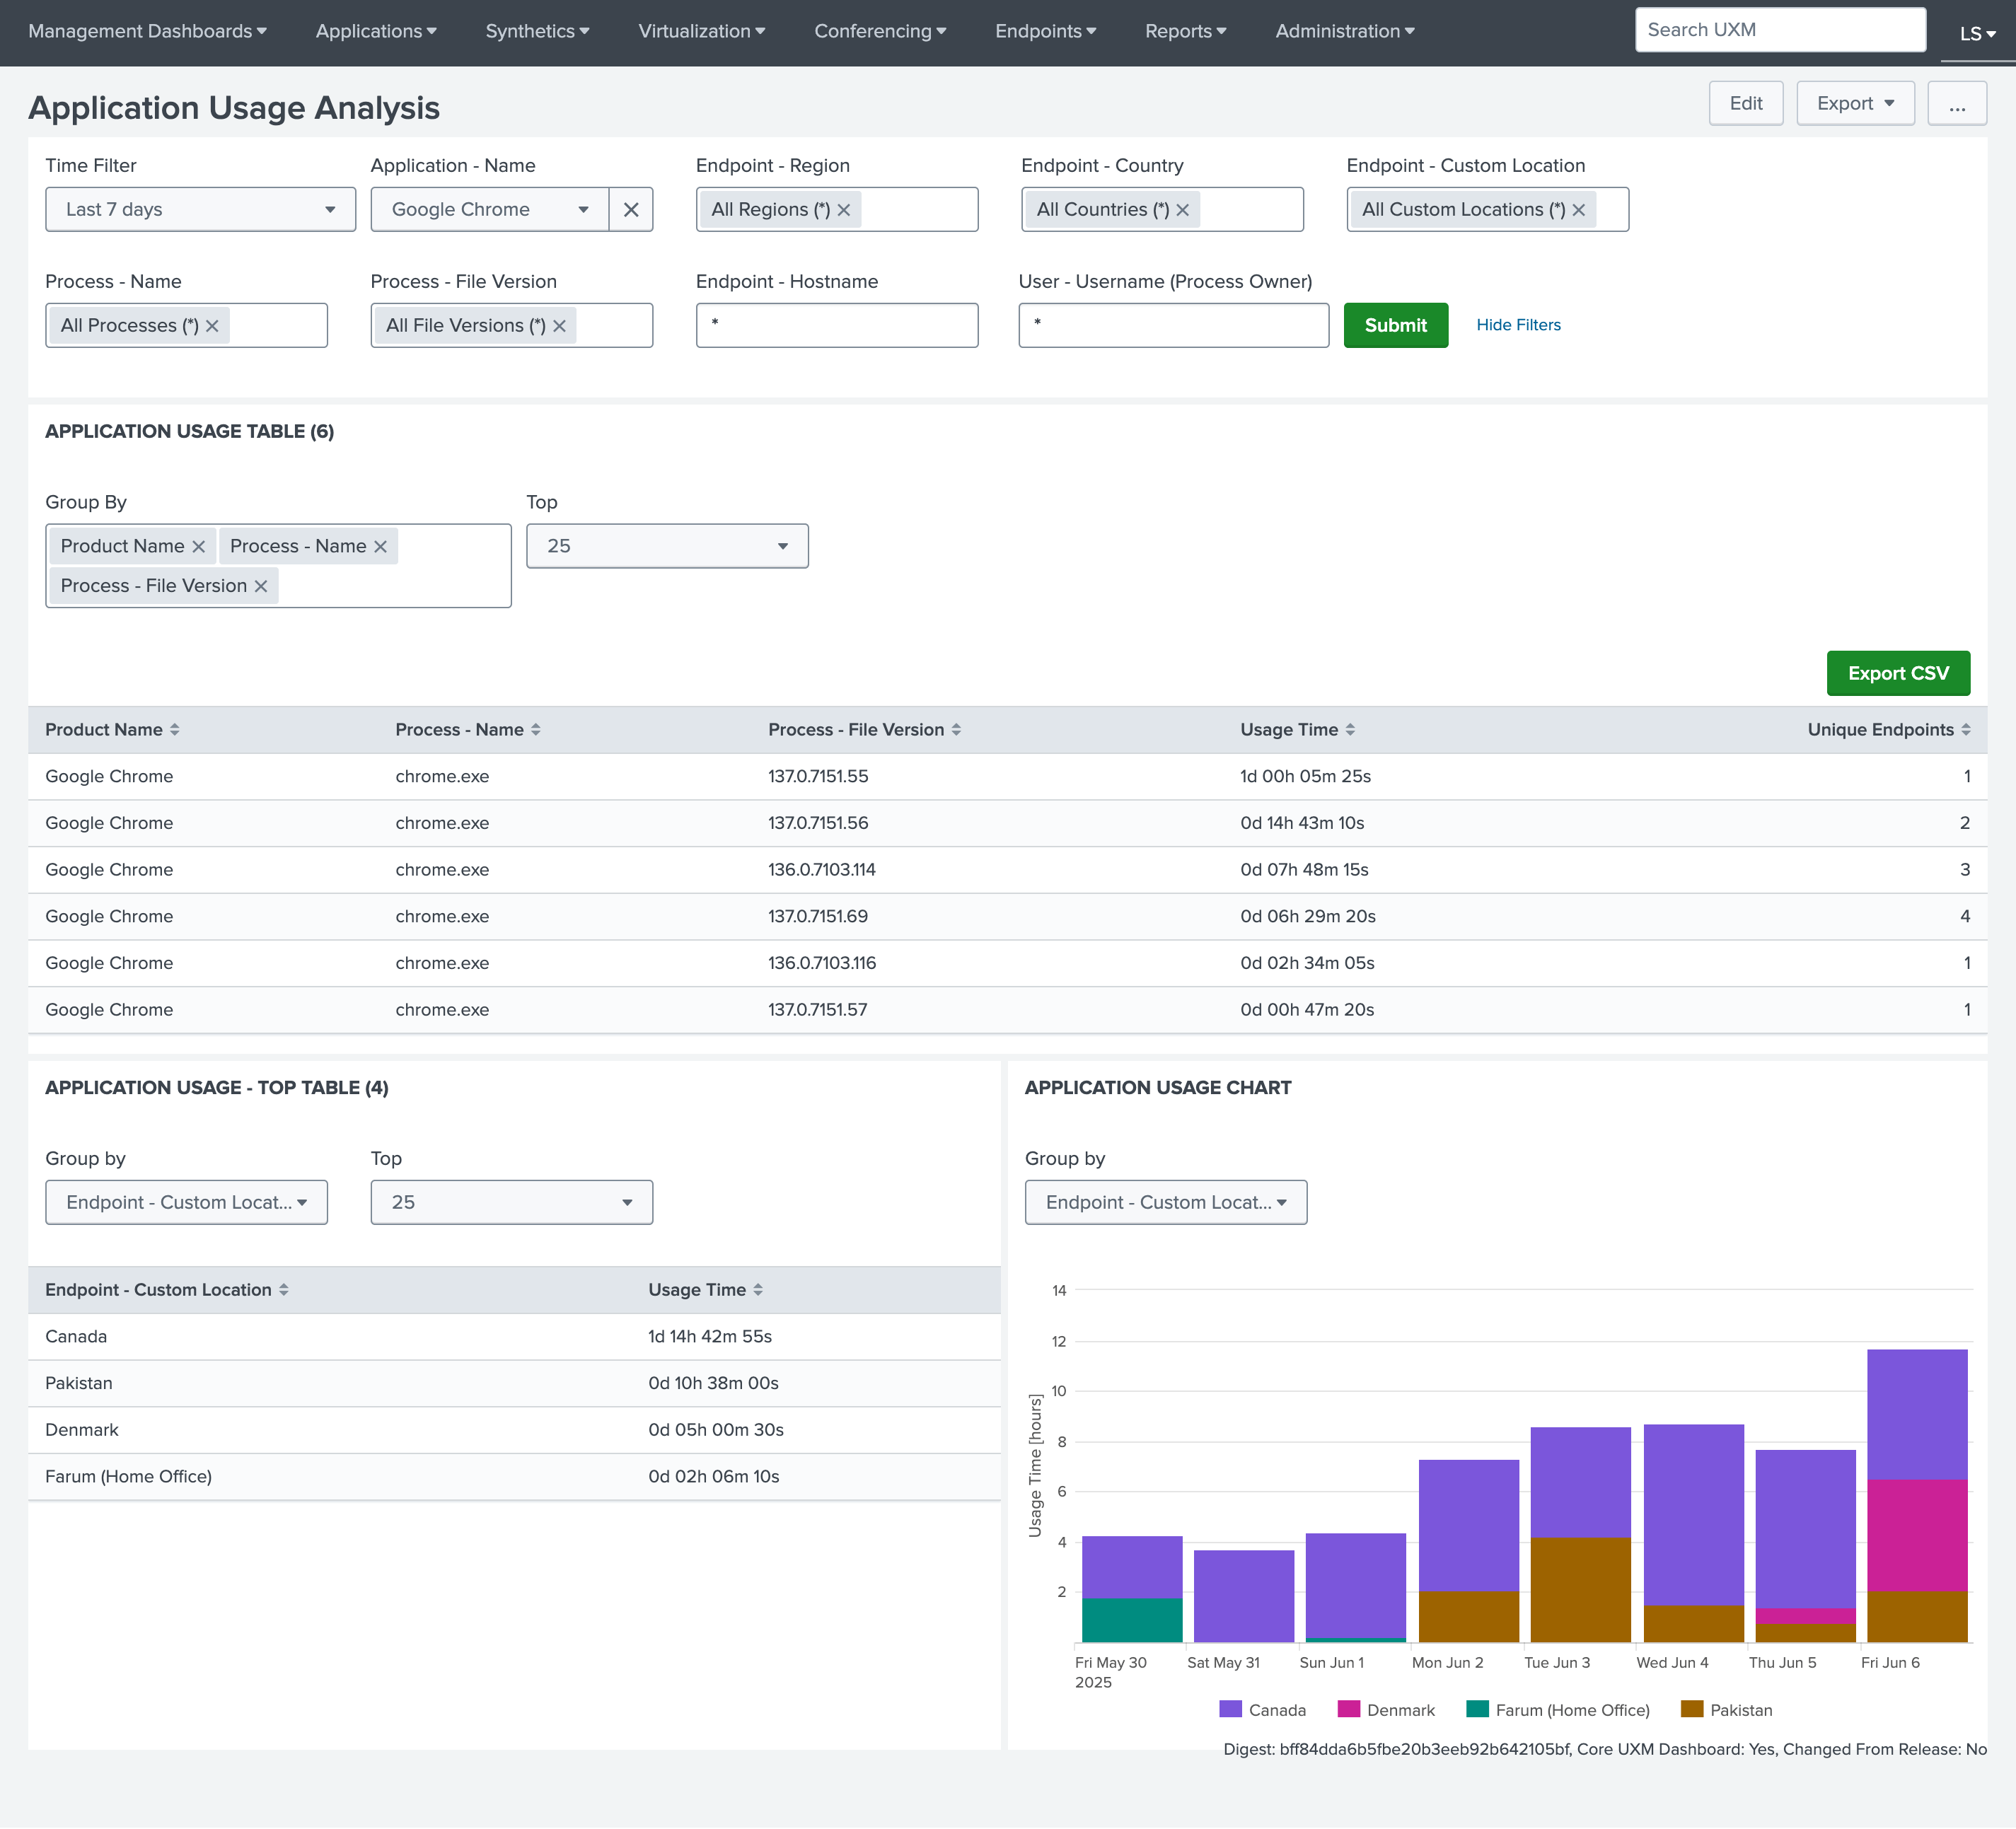
Additional columns can be added/removed from Group by selection.