Website and Browser Error Monitoring Dashboard
Website and Browser Error Monitoring Dashboard
Introduction
This documentation provides an overview of the Website and Browser Error Monitoring Dashboard, which is designed to help system administrators and web developers track and analyze website and client browser errors.
Dashboard Overview
The dashboard is divided into sections, each providing critical data about the performance and stability of web applications from both the server and client-side perspectives.
Visual References:
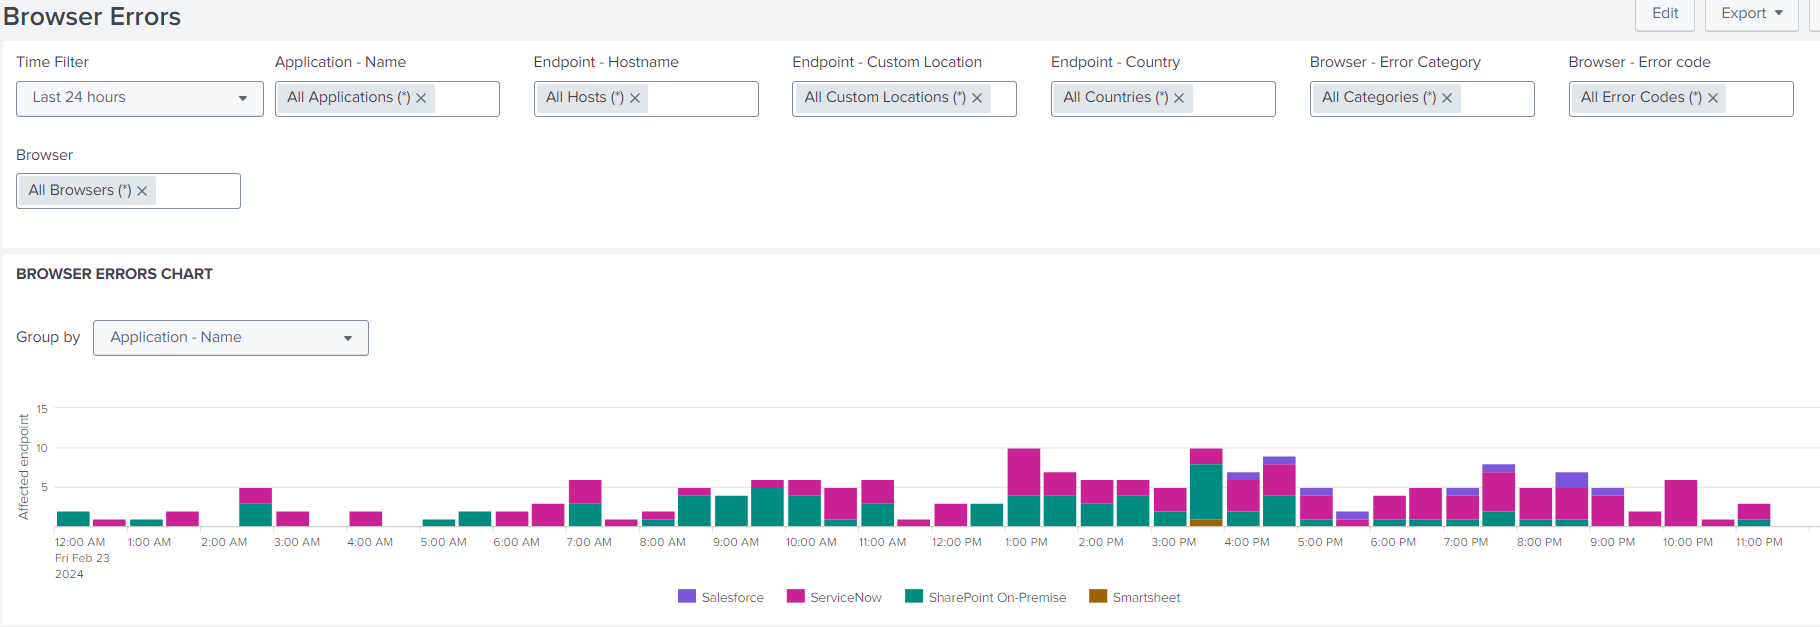
Browser Errors Chart
Purpose:
To visualize the frequency and distribution of browser errors over time.
Features:
- Group errors by application, endpoint, or error type.
- Filter data by a specific time range for detailed analysis.
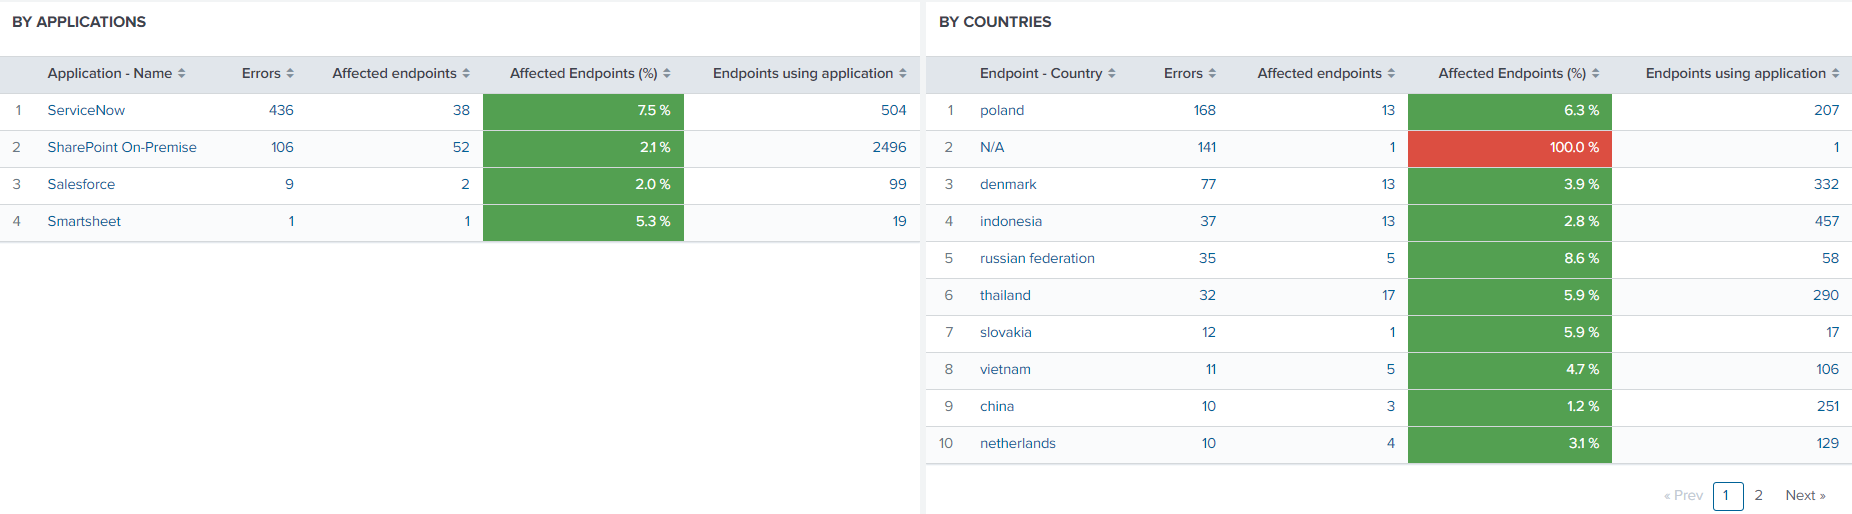
Errors by Applications
Purpose:
To identify which applications experience the highest number of errors.
Features:
- Lists applications with error counts.
- Indicates affected endpoints and their percentage of total impact.
Errors by Country
Purpose:
To pinpoint geographic regions where users encounter frequent errors.
Features:
- Provides a breakdown of errors by country.
- Helps detect regional performance or localization issues.
Errors by Category and Error Code
Purpose:
To classify errors for faster, more precise troubleshooting.
Features:
- Categorizes errors by type (e.g., network, client, server).
- Displays exact error codes for targeted debugging efforts.
Detailed Error Table
Purpose:
To access detailed technical information about every captured error instance.
Features:
- Displays the application name, endpoint hostname, and custom location.
- Includes error category, error code, and browser details where the issue occurred.
Why Is This Relevant?
Continuous monitoring of website and client-side browser errors is vital for maintaining an excellent user experience and ensuring system reliability. Systematic analysis of this error data provides valuable insights across four key domains:
1. System Reliability
Error analysis highlights recurring issues and their root causes.
By addressing these patterns, organizations can enhance system stability and reliability.
2. User Experience (UX)
Fast detection and resolution reduce user disruption.
This proactive approach ensures a seamless and intuitive user journey.
3. Security and Compliance
Monitoring errors can uncover potential security vulnerabilities and verify adherence to industry standards and compliance requirements.
4. Performance Optimization
Error trends reveal opportunities to optimize server-side and client-side performance.
By understanding these error types, system performance can be tuned for higher efficiency.